Gold And Silver Markets Zoom


When looking at the short-term minute charts, things look very volatile in the precious metals complex. However, the further you look back in time, the less volatile the price action becomes. If you are a day trader, then the minute charts are the ones to focus in on - but if you’re an intermediate-term trader perspective is everything.
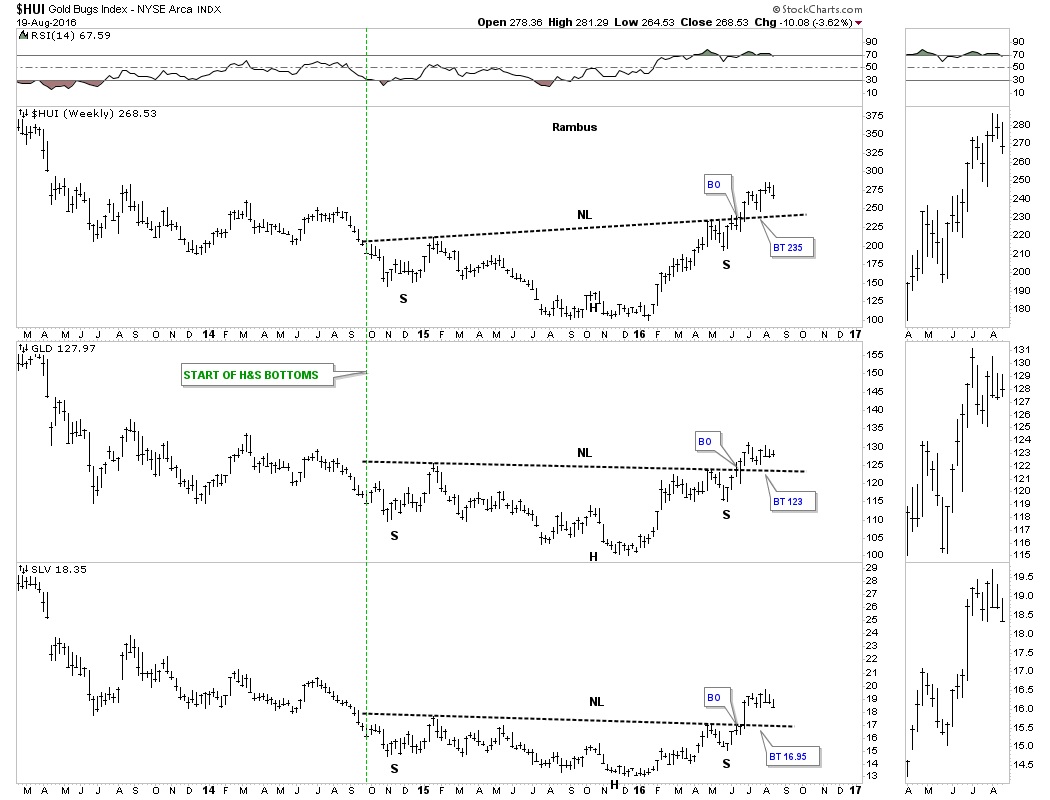
Looking at the five year weekly combo chart below, the precious metals complex has been building out a beautiful uptrend since the January 2016 low. There is nothing on any of these three charts that suggests a top is in place or it’s time to sell. The thin black dashed horizontal lines taken from the previous highs is our first line in the sand for support. Note the left side of the chart and how the thin black dashed horizontal lines held resistance, when they were broken to the downside which is bear market action. What we have since January is bull market price action.
If one had tried to buy any of these three sectors during the impulse move down out of the 2012 top to the June 2013 low for a counter trend rally, they would have been crushed like a bug against the windshield of a car. Even if I gave you the exact low could you have reversed back to the short side in time to protect any of the small profits you may have made? Looking at the price action since the January 2016 low, how many traders do you think have won big shorting this new bull market?
The golden rule is, don’t buy a bear market and don’t short a bull market. There are always exceptions to the rule - but for the little guy, that doesn’t understand how the markets work, it’s like taking candy from a baby for those that truly understand how the most difficult game on the planet works.

Below is the inverse Head&Shoulders combo chart for the HUI, GLD and SLV. Think of the necklines as your line in the sand, above is bullish and below is bearish. Until they’re breached to the downside I have to remain a bull and everything else is noise. It doesn’t have to be complicated. Have a great weekend and all the best.
 Meet Rambus, a seasoned trader and technical analyst renowned for his unbiased and insightful chart work. Through his website, Rambus Chartology, and Substack newsletter, Rambus shares his expertise with a global community of subscribers, providing daily updates, commentaries, and hands-on training in the art and science of chartology. With his calm, humble, and down-to-earth approach, Rambus demystifies complex market trends, helping his followers navigate the challenges of today's volatile markets. Join the Rambus Chartology community today and discover a unique blend of technical analysis, trading expertise, and time-tested protocols. Subscribe now at www.rambus1.com or https://rambuschartology.substack.com/
More from Gold-Eagle


