Gold Forecast: Cycles Forge Ahead Into Key 'Panic' Zone
 share
share
 share
share
 share
share
 share
share
 share
share
 Recapping Last week
Last week's trading saw gold forming its high in early-week trading, here doing so with Tuesday's spike up to the 2078.80 figure. From there, a sharp decline was seen into late-week, with the metal dropping all the way down to a Friday low of 1960.90 - before bouncing off the same into the weekly close.
Gold Market, Short-Term
For the near-term action, the current correction phase is coming from the smallest- tracked wave, the 10-day component, shown again on the chart below:
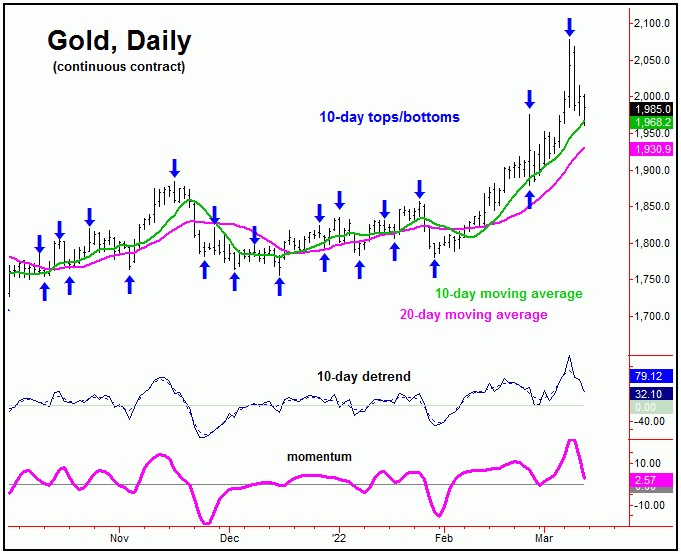
From last weekend: "should Gold take out the 1976.50 swing top, then we will have to label a 10 and 20-day trough in place, though there would still be the risk for a quick spike down to the 20-day moving average. That same moving average looks to be a key support level, should it be attempted at any point in the days ahead."
As mentioned above, taking out the 1976.50 swing top inferred a prior 10 and 20-day trough having formed with the February 24th low of 1878.60 - though it did so without our customary tag of the 20-day moving average. Following my rule in regards to cycles and moving averages, we should expect to see approximately 85-90% of the downward phases of the 20-day wave reverting back to this 20-day average.
Going further with the above, taking out the 1976.50 swing top saw an additional 100 points of upside follow-through into the March 8th peak. By the time that our 10 and 20-day trough was confirmed to have been registered, however, the smaller 10-day component was already 7 trading days along into its new upward phase.
With the above said and noted, we pointed out (in our Gold Wave Trader report) that the metal was due for another quick correction off the top, coming from this same 10-day wave. In terms of price, the 10-day moving average was noted as the ideal downside magnet, which was easily hit - doing so with Friday's early-day decline.
The chart below shows the larger 20-day cycle:
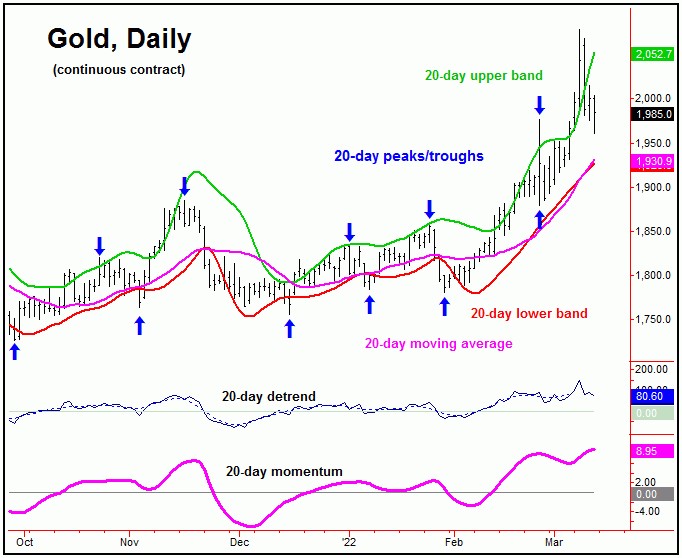
Stepping back slightly, the current downward phase of the 10-day cycle has support around the 10 and 20-day moving averages - if the upward phase of the larger 72-day cycle is going to remain intact. In other words, if this range of support is able to hold the current decline, then gold can see one more spike back to or above the highs in the next week or so, before completing an extended 72-day peak.
Here again is that larger 72-day cycle:
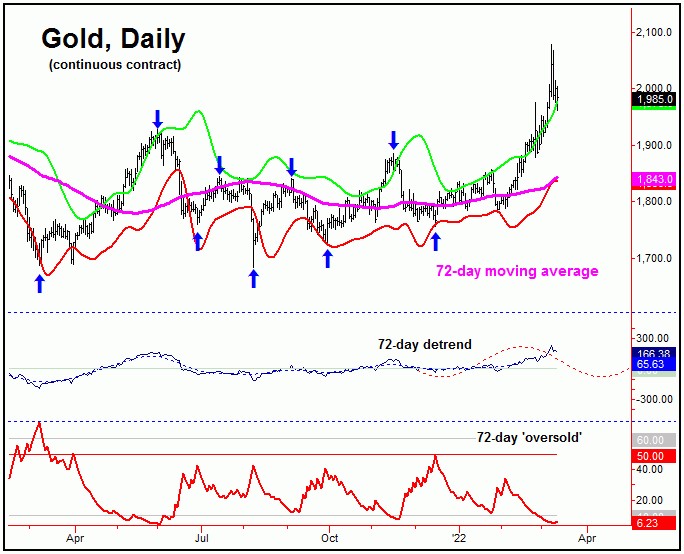
Gold Market, 3-6 Week View
Stepping back, the next correction of significance is still expected to come from the larger 72-day wave - which is now moving into extended territory. In terms of price, it was the early-January close above the 1818.00 figure (our upside reversal point at the time) that originally confirmed the upward phase of this wave to be in force.
With our 72-day 'oversold' indicator spiking below its lower reference line - and price well above the upper 72-day cycle band - this cycle is looking for its next peak to occur at anytime, and may have already formed with last week's tag of the 2078.80 figure. However, that has yet to actually be confirmed - by taking out a key level that we are watching in our Gold Wave Trader report.
Otherwise, if gold can hold short-term support (10 and 20-day moving averages) with the smaller 10-day cycle downward phase, then it could see one final spike higher into our March 16-21 'panic' zone - which was noted in last weekend's article. If seen, that move would be strongly favored to peak our extended 72-day cycle.
Once this 72-day wave does top, a decent correction into early-April is expected to play out, one which sees the 72-day moving average and/or lower 72-day cycle band acting as the magnet. That same region could provide a key mid-term support level, if the larger bullish trend is going to remain intact into mid-Summer, before topping the larger 154 and 310-day cycles. More on the bigger-picture assessment with these waves as we move forward.
Jim Curry
The Gold Wave Trader
http://goldwavetrader.com/
http://cyclewave.homestead.com/
********
share
share
share
share
share