Gold Forecast: Gold Inching Towards The Finish Line
 share
share
 share
share
 share
share
 share
share
 share
share
 Recapping Last week
Following an early-week consolidation to the downside, Gold saw both its high and low for last week registered in Friday's session, with the low made in early-day trading with the tag of 1826.50 - followed by a spike back to new highs for the swing with the late-day tag of 1879.60. For the five day period, Gold gained approximately 25 points, a decent gain from the prior weekly close.
Gold Market, Short-Term
For the very short-term, the analysis presented in our Gold Wave Trader report favored the most recent short-term correction to come from the combination of 10 and 20-day cycles, which saw the 20-day moving average acting as the magnet to the recent downward phase of these waves.
The chart below shows the smaller 10-day cycle:
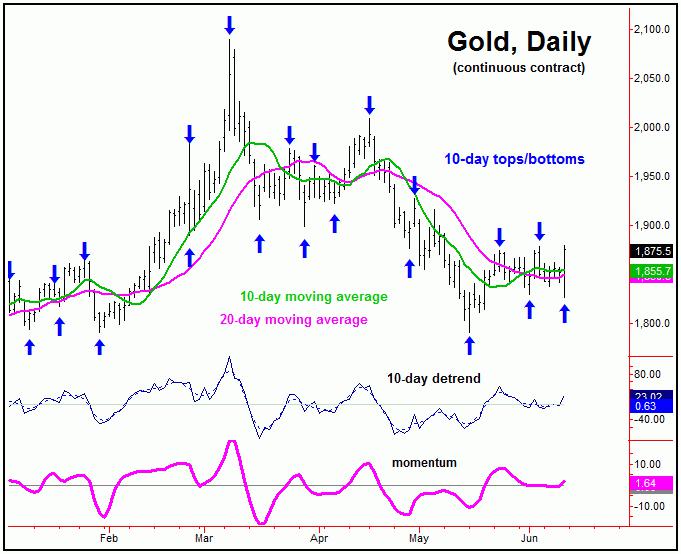
In terms of patterns, the correction phase of these 10 and 20-day waves was expected to end up as a countertrend affair - holding above the prior swing low of 1791.20 - which was the last trough for our larger 20-day component.
With Friday's late-day reversal back to new highs for the swing, our 10 and 20-day trough had to have formed early-Friday, and with that the combination of these waves is now seen as heading back to the upside.
Gold Closing in on the Finish Line
From the comments made in past articles, the last low of significance for Gold was expected to come from our larger 72-day cycle, which was registered back in mid-May - and which is shown again on the chart below:
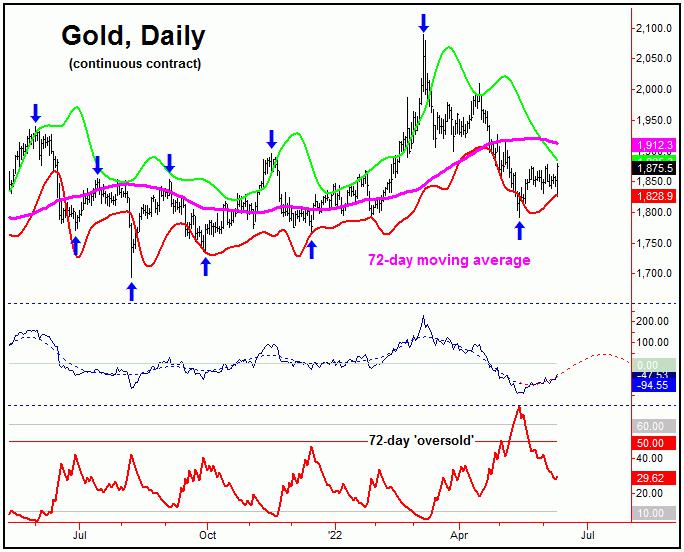
With the position of the 72-day cycle projected higher into July, the probabilities favored the most recent short-term decline with the 10 and 20-day cycles to end up as a countertrend affair - which it was able to do.
In terms of patterns, a countertrend decline with the 10 and 20-day cycles was then expected to give way to higher highs on the next upward phase of those two waves, before topping the larger 72-day component. With Friday's late-day action, we now have that higher high, and thus are now working on our next key price peak for the metal - expected to come from this same 72-day cycle.
In terms of time, the overall assumption has been that the upward phase of the 72-day wave would hold up into the early-July timeframe or later - simply based upon (1) a statistical analysis of this wave, in regards to time, and (2) the position of our detrend's projected path for this cycle.
Stepping back, from whatever high that does form with our 72-day cycle in the coming weeks, the probabilities will favor another larger percentage decline into what looks to be the Autumn of this year, one which seems likely to drop back below the 1791 swing bottom, the late-May trough.
That move down should end up as the next mid-term low for Gold, coming from the bigger 310-day cycle - which is shown again on our next chart:
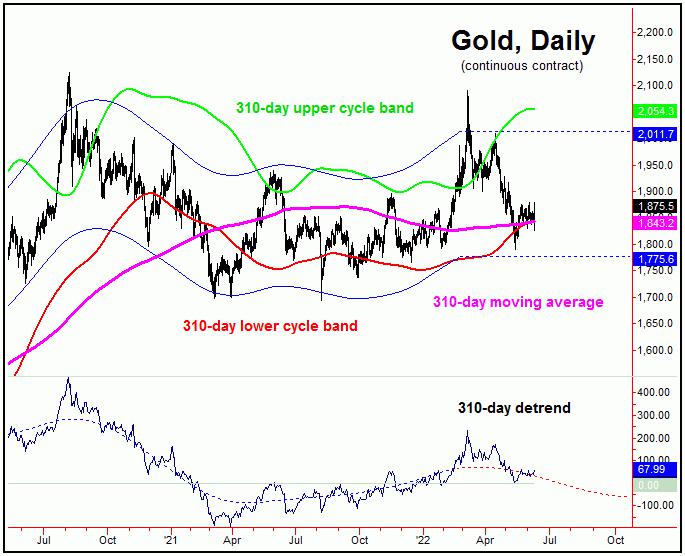
Going further with the above, the next move down into our 310-day cycle bottom should end up as the next mid-term low for Gold. What follows should be an much larger percentage rally on the next swing up with this 310-day component, with the average rallies with this cycle having been around 25% from trough-to-peak.
With the above said and noted, we are watching some key technical signals in the days/weeks ahead, in the anticipation of the next 72-day cycle top forming. From there, as mentioned, another sharp decline phase is expected to follow with this component, ideally taking the metal back to or below the May trough into the Autumn of this year - then to be on the lookout for the next mid-term low to form. Stay tuned.
Jim Curry
The Gold Wave Trader
http://goldwavetrader.com/
http://cyclewave.homestead.com/
*******
share
share
share
share
share