Gold Forecast: Gold Readying to Rock-And-Roll


 Recapping Last week
Last week's trading saw Gold forming its low in Monday's session, here doing so with the tag of the 1740.20 figure. From there, strength was seen into late-week, with the metal pushing up to a Thursday high of 1778.80 - before backing off the same into the weekly close.
Gold Market, Short-Term
From the comments made in recent articles, the cycles were into topping range back in early-August, with key resistance to that high noted at the 1824-1833 region. The actual peak came in on 8/10/22, made at the 1824.60 figure - right into the lower end of this resistance zone.
From there, we were looking for a decent correction to unfold, coming from the smaller- degree cycles, the 10 and 20-day waves. In terms of price, the path favored a drop back to the 20-day moving average or lower as they bottomed out, a move which was anticipated to end up as countertrend.
The chart below shows our 20-day cycle in the Gold market:
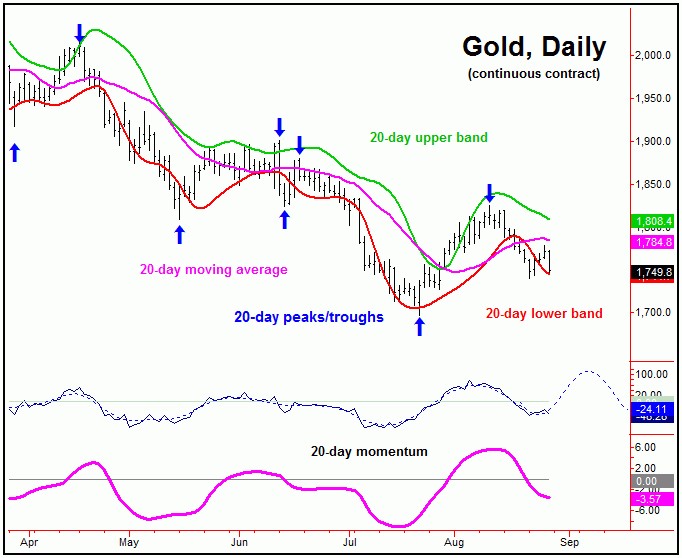
In terms of time, at the most recent lows these 10 and 20-day cycles were back into bottoming range, and with that, as mentioned, were favored to form a countertrend bottom - holding above the mid-July trough.
For the short-term picture, the probabilities lean in favor of our 10 and 20-day low having already formed - though it will be the action in the coming days that offers up more telling information.
If the 10 and 20-day cycles have bottomed, the ideal path is looking for a push back above the 1824.40 swing top in the coming weeks, before a larger peak attempts to form - coming from the bigger 72-day cycle, shown on our next chart:
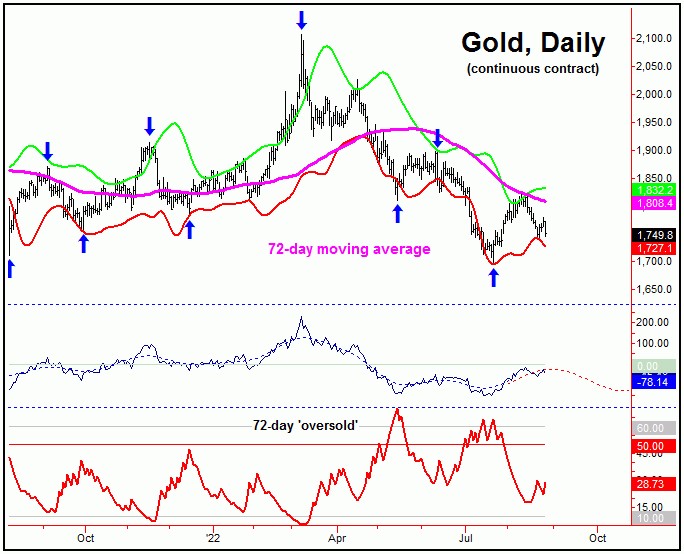
In terms of time, the best spot for this larger 72-day cycle to peak looks to be into mid- September, plus or minus. If Gold does push back above the 1824 swing top in the coming weeks, then the probabilities will favor our next key peak forming with the 72-day cycle - with a precise level of resistance for the move to peak noted in our Gold Wave Trader market report.
Gold Market, Mid-Term
Stepping back, from whatever top that does form with the 72-day cycle going forward, the odds will favor a decent decline playing out into the mid-October timeframe, where this wave is next projected to trough.
Going further with the above, the same mid-October region is when our larger 310-day cycle is also due to bottom, with this cycle shown again on our next chart:
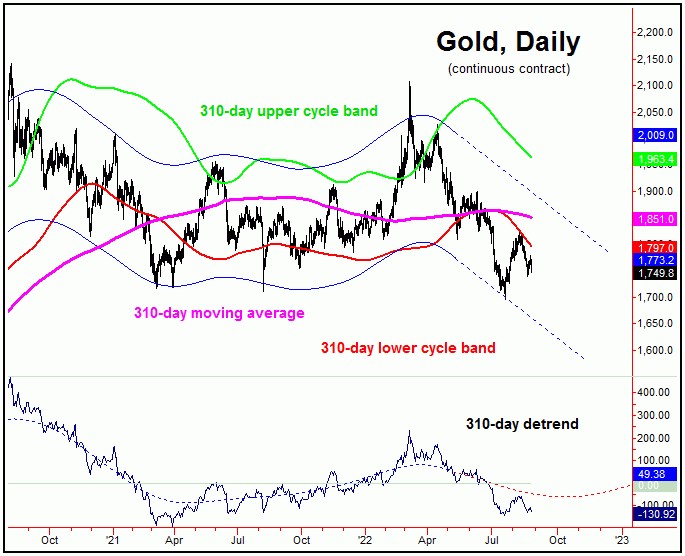
For the bigger picture, the next mid-term should come from this larger 310-day cycle. What follows off this low should be the most significant rally of this year. In terms of price, the average upward phases of this 310-day cycle have been around 20-25% or more off the bottom, thus giving us some idea of how it should resolve.
In terms of time with the above, the next upward phase of this 310-day cycle should see a multi-month rally, one that likely plays out into the Spring of next year - before forming yet another mid-term peak for Gold. From there, another sharp decline would be expected to play out into later next year and/or into early-2024, a wide range to expected another 310-day trough to form. Stay tuned.
Jim Curry
The Gold Wave Trader
http://goldwavetrader.com/
http://cyclewave.homestead.com/
********


