Gold: A Key Trend Line And M2V


Most mainstream money managers and gold analysts believe that US rate hikes are deflationary. In contrast, in the current global economic environment, I see them as inflationary.
I made it clear several years ago that I viewed QE as a deflationary force, and tapering as inflationary.
The tapering of QE laid the groundwork for a wave of reflation that rate hikes will bring to the world. Does “Mr. Market” agree with me?
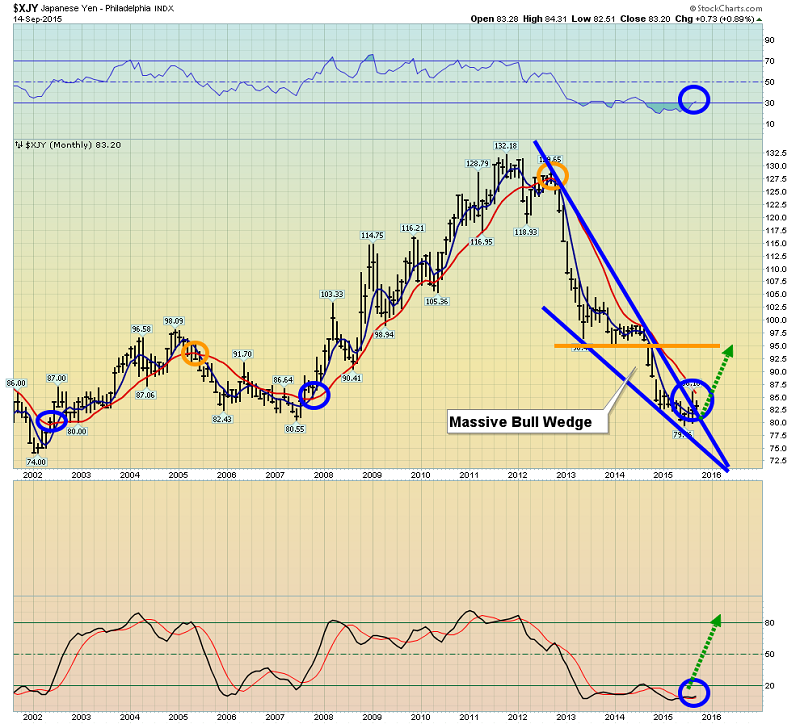
That’s the monthly chart of the Japanese yen versus the US dollar.
The yen peaked in the fall of 2011, and in late 2012 my 5,15 moving average series flashed a key sell signal. That occurred just as the yen was completing a large head and shoulders top pattern.
Large FOREX traders tend to base a lot of their gold trades on their analysis of the yen. There are signs that the 5,15 moving average will soon flash a buy signal for the yen, and it’s staged an upside breakout from a massive bull wedge pattern.
What’s particularly impressive is that the yen has rallied in the face of Janet Yellen’s frequent warnings about US rate hikes.
Gold rose alongside the yen from the late 1990s until 2011. It can rally in a similar way again, but for gold price parabola enthusiasts, there’s a much more important chart that bears watching.
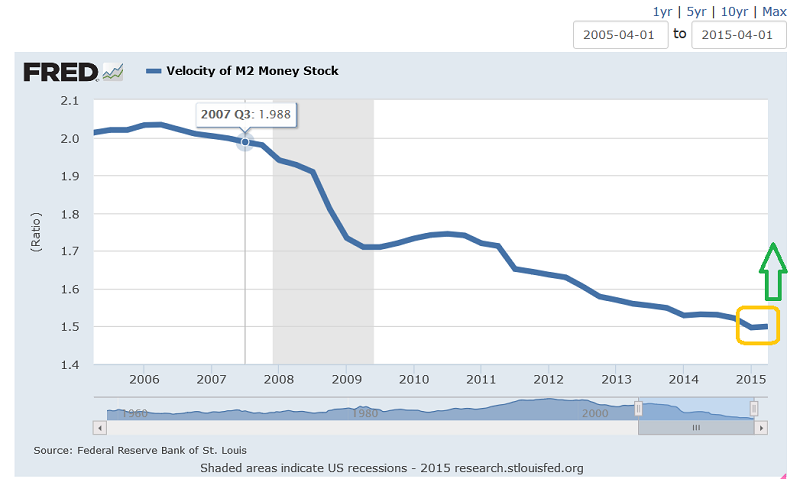
That’s the St. Louis Fed’s M2 money velocity chart (M2V).
Inflation comes from rising money velocity, and hyper-inflation comes from a hyper-rise in money velocity. In 2008 – 2009, M2V did turn higher, but the nature of the QE stimulus program meant that the rise was a meagre one.
Simply put, the Fed’s QE program increased the size of the overall US money supply, but stifled its velocity. Personally, I was horrified as I watched US congress allow the Fed to run its QE program without forcing the printed money to be loaned out into the general economy.
Thus, any economic stimulus created by forcing interest rates lower with QE was overwhelmed by the implosion in money velocity that it also created. The QE money went to government bonds and the banks, and the banks hoarded the money rather than loaning it out.
I believe Janet Yellen is attempting to rectify this terrible situation, with immediate rate hikes and a reduction in the Fed’s T-bond holdings. That will incentivize the banks to make loans, and put pressure on US congress to reduce its entitlement programs.
The size of the US government is the single biggest problem facing the US economy. The fact that the government is soaked in debt adds gasoline to the fire, but it’s the overall size of government that is the main problem for the economy. The bottom line is that America’s largest manufacturer is the US government, and the main product it manufactures is: red tape.
The yen is almost certainly rallying in anticipation of US rate hikes that produce an upturn in money velocity. That upturn is what will create substantial inflation in America, and do it very quickly.
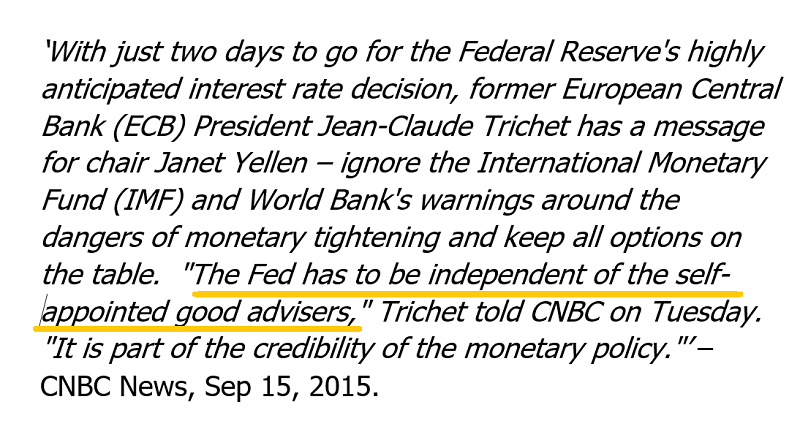
Clearly, former ECB President Trichet agrees with me that the Fed doesn’t need the IMF or the world bank to rain on their “rate hikes parade”. Trichet himself tried to raise rates in the past, and I think he was stonewalled by entities interested in bigger government and a smaller private sector. I don’t think Janet Yellen will be so easily swayed from her plan of action, as her relentless taper to zero of QE has showed.
The money velocity chart has lost downside momentum, and has flat lined in the last quarter. I think the first rate hike will be followed by an enormous spree of bank lending, and that will mark the end of what is roughly a 20 year bear market in US money supply velocity.
Gold price parabola enthusiasts shouldn’t put on their space helmets yet, but they should start watching the M2V chart more closely than the Dow and T-bonds.

That’s the quarterly bars gold chart. On it, I’ve drawn what is arguably the world’s most important trend line. Drawing a trend line across the 1980 high of about $873 and the $1033 area of 2008 suggests that the recent decline to the $1070 area may produce a significant low.
When fundamentals are factored in, like the new PBOC gold buy program, the massive rise in Indian silver imports, and inflationary US rate hikes, it’s clear that this trend line may carry considerable weight, not just for gold bulls, but for gold price parabola enthusiasts.

That’s the daily gold chart. Note the superb position of my 14,7,7 Stochastics series. It peaked as gold peaked at $1170.
Gold looks very solid now, both in the short term and the long term, and from both a fundamental and technical perspective.
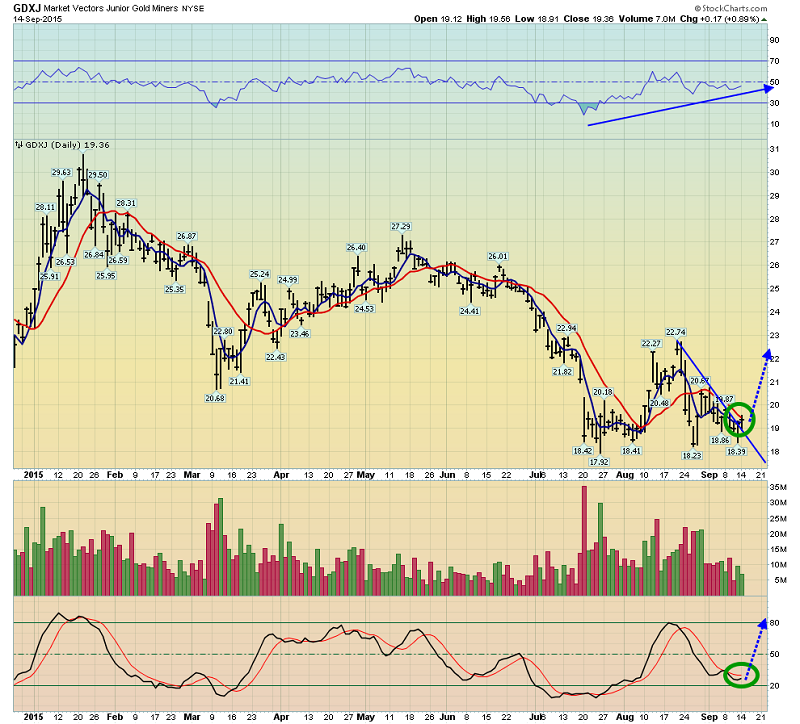
That’s the GDXJ daily chart. Like the M2V chart, GDXJ has begun to trade sideways. Relative strength (RSI) is strong, and the 14,7,7 Stochastics series oscillator is verging on a fresh buy signal.
I’ll ask the Western gold community to follow Trichet’s lead, and let Janet do her job. Let’s watch her reverse money velocity and pressure government size with rate hikes, to begin the biggest gold stock rally of the past several years!
********
Special Offer For Gold-Eagle Readers: Please send me an Email to [email protected] and I’ll send you my free “Gold Stocks & The CRB Index” report. Numerous components of the CRB index have begun surging in recent weeks. I cover those in this key report, and their bullish effects on the price of ten key junior resource stocks!
Note: We are privacy oriented. We accept cheques. And credit cards thru PayPal only on our website. For your protection. We don’t see your credit card information. Only PayPal does. They pay us. Minus their fee. PayPal is a highly reputable company. Owned by Ebay. With about 160 million accounts worldwide.
Email: [email protected]
Rate Sheet (us funds):
Lifetime: $799
2yr: $269 (over 500 issues)
1yr: $169 (over 250 issues)
6 mths: $99 (over 125 issues)
To pay by cheque, make cheque payable to “Stewart Thomson”
Mail to:
Stewart Thomson / 1276 Lakeview Drive / Oakville, Ontario L6H 2M8 Canada
Stewart Thomson is a retired Merrill Lynch broker. Stewart writes the Graceland Updates daily between 4am-7am. They are sent out around 8am-9am. The newsletter is attractively priced and the format is a unique numbered point form. Giving clarity of each point and saving valuable reading time.
Risks, Disclaimers, Legal
Stewart Thomson is no longer an investment advisor. The information provided by Stewart and Graceland Updates is for general information purposes only. Before taking any action on any investment, it is imperative that you consult with multiple properly licensed, experienced and qualified investment advisors and get numerous opinions before taking any action. Your minimum risk on any investment in the world is: 100% loss of all your money. You may be taking or preparing to take leveraged positions in investments and not know it, exposing yourself to unlimited risks. This is highly concerning if you are an investor in any derivatives products. There is an approx $700 trillion OTC Derivatives Iceberg with a tiny portion written off officially. The bottom line:
Are You Prepared?
 Stewart Thomson is president of Graceland Investment Management (Cayman) Ltd. Stewart was a very good English literature student, which helped him develop a unique way of communicating his investment ideas. He developed the “PGEN”, which is a unique capital allocation program. It is designed to allow investors of any size to mimic the action of the banks. Stewart owns GU Trader, which is a unique gold futures/ETF trading service, which closes out all trades by 5pm each day. High net worth individuals around the world follow Stewart on a daily basis. Website: www.gracelandupdates.com.


