Gold Market Update
 share
share
 share
share
 share
share
 share
share
 share
share
In the context of the magnitude of the rally from the December lows that preceded it, gold’s reaction from its March highs, see 1-year chart below, seems like a reasonable correction, although there have been some factors indicating that this is not a normal healthy reaction, such as the high downside volume, particularly in stocks.
Gold was expected to make it to the resistance shown in the $1420 area, it didn’t, and that’s a negative, especially as the COT exploded to extreme readings at the March peak, indicating that the rally from the December lows may have been a relief rally in an ongoing bearmarket, and if it was, it implies that the price will proceed to break down beneath its lows of last June and December. Given the potential seriousness of the crisis in the Ukraine, it is surprising that gold is not doing better. Gold could turn up from the support at $1280, but if this fails, we are likely to see a retest of the lows above $1180. The volume pattern is not favorable however, as already mentioned, and nor is the general commodity COT, which we will come to later, which suggests that commodities will go down with stocks a little later in the year, in a depressing rerun of what we saw in 2008.

The long-term chart for gold still looks hopeful. On its 15-year chart we can see that gold still looks like it is basing above its long-term uptrend line. However if this uptrend line fails, and the nearby important support at the lows of last June and December is breached, then gold is likely to drop back to the strong support in the $1000 area. This is what Goldman Sachs is calling, and what Goldman wants it often gets, as it did a year ago, because it is an elite organization with massive power and influence. Tactically the right way to handle this is to stay long, if long, and either get out on stop if $1180 fails or hedge accordingly

The long-term 20-year arithmetic chart for gold continues to show that this is a good point for gold to turn up, as it is still not far above its parabolic uptrend line, that could theoretically slingshot gold much higher. However, if this uptrend does fail and gold drops back to $1000, it will inflict heavy technical damage on gold, and may even imply that the world is tipping into a deflationary implosion. Massive deflationary forces are still out there, wanting as ever to correct the excesses of the past, but they are still being held at bay and worsened by insane and crassly irresponsible money printing on a scale that would certainly impress that great pioneer of inflationary excess, his imperial excellency Mr Robert Mugabe of Zimbabwe. All of this QE and global money supply expansion to avert deflation can be compared to the way the sea recedes before a tsunami, once the deflationary forces return with a vengeance, the result will be utter devastation. Once this occurs, commodities and stocks will crater

Gold COT charts have eased from their extreme readings of mid-March so that they are now in middling ground, and while this opens up the possibility of a rally, there is still considerable room for improvement on these COT charts.
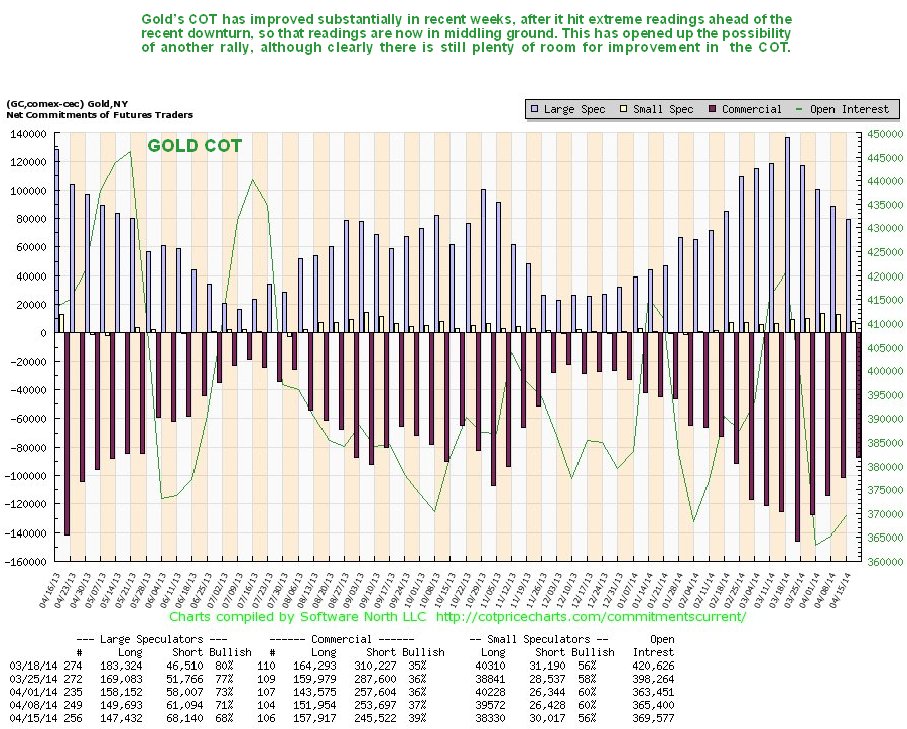

Chart courtesy of www.sentimentrader.com
The dollar is now at a critical juncture. The view is now widespread that it will crash the key support shown on our 3-year chart for the dollar index at 78 – 79 and drop hard, which would of course be great news for gold and silver. On our chart we can see that the Distribution Dome shown looks set to force such a breakdown imminently, especially as moving averages are in bearish alignment. However, the dollar has a perverse habit of suddenly wrong footing the majority and doing the exact opposite of what they expect. So what could happen here is a surprise upside breakout from the Dome, which would be expected to lead to a powerful rally. Maybe an army of Russian gangsters will suddenly change all their rubles into dollars (lol).

While the dollar chart does look set to break down on its charts, our suspicion that it might do the exact opposite is given credence by the latest COTs, which show that the Commercials have reduced their long positions in the dollar to a very low level, while the Large Specs have reduced their long positions to a very low level. This is bullish, and portends a probable upside breakout soon – now that will be bearish for gold and silver, and bearish for commodities generally, and we would expect for stocks too.

Chart courtesy of www.sentimentrader.com
Public opinion on gold is now in middling ground, and is in itself neither bullish nor bearish…

Chart courtesy of www.sentimentrader.com
The Rydex traders have very low assets in the Precious Metals, which in itself is bullish, as they are usually wrong, but this should be weighed against all the other considerations set out here.

Chart courtesy of www.sentimentrader.com
Conclusion: if the dollar should break down soon then gold and silver are in position to start another major upleg. However COTs are indicating that instead there is a strong chance of a major dollar rally developing soon that would pull the rug out from under commodities and stocks, which would likely decline in tandem. There may be a little further upside in stocks, perhaps going into May, before this possible scenario unfolds.
share
share
share
share
share

Clive P. Maund’s interest in markets started when, as an aimless youth searching for direction in his mid-20’s, he inherited some money. Unfortunately it was not enough to live a utopian lifestyle as a playboy or retire very young. Therefore on the advice of his brother, he bought a load of British Petroleum stock, which promptly went up 20% in the space of a few weeks. Clive sold them at the top…which really fired his imagination. The prospect of being able to buy securities and sell them later at a higher price, and make money for doing little or no work was most attractive – and so the quest began, especially as he had been further stoked up by watching from the sidelines with a mixture of fascination and envy as fortunes were made in the roaring gold and silver bull market of the late 70’s.
Clive furthered his education in Technical Analysis or charting by ordering various good books from the US and by applying what he learned at work on an everyday basis. He also obtained the UK Society of Technical Analysts’ Diploma.
The years following 2005 saw the boom phase of the Gold and Silver bull market, until they peaked in late 2011. While there is ongoing debate about whether that was the final high, it is not believed to be because of the continuing global debasement of fiat currency. The bear market since 2011 is viewed as being very similar to the 2-year reaction in the mid-70’s, which was preceded by a powerful advance and was followed by a gigantic parabolic price ramp. Moreover, Precious Metals should come back into their own when the various asset bubbles elsewhere burst, which looks set to happen anytime soon.
Visit Clive at his website: CliveMaund.com