Gold Market Update


COTs, sentiment and public opinion and a raft of technical indicators are all at low extremes that continue to indicate that gold is marking out a major low here and set to reverse to the upside before long. So you can safely ignore all the fair weather pundits who are coming out of the woodwork to proclaim gold’s bullmarket dead, and also the plethora of bearish articles appearing in the mainstream media at Big Money’s behest in order to squeeze the last drop of blood out of the little guy before the next big rally starts.
Last week’s update was probably the most bullish we ever produced, and the picture hasn’t changed much since, except that the dollar and Treasuries have broken out upside, but for reasons that we will come to later this won’t stop gold reversing to the upside, and public opinion has become even more negative, which of course is bullish.
On gold’s 8-month chart we can see that the 4-day rally into last Tuesday’s close resulted in it rising too far too fast, given its prior downtrend. This was the reason it dropped back down during the rest of the week for a retest of support. However, bears started to lose control on Friday, evidenced by a “spinning top” candlestick appearing on the chart. When such a candlestick appears on a chart after a drop, it frequently portends a rally. As we can see gold is still deeply oversold on its MACD indicator and very near the bottom of an intermediate downtrend channel.
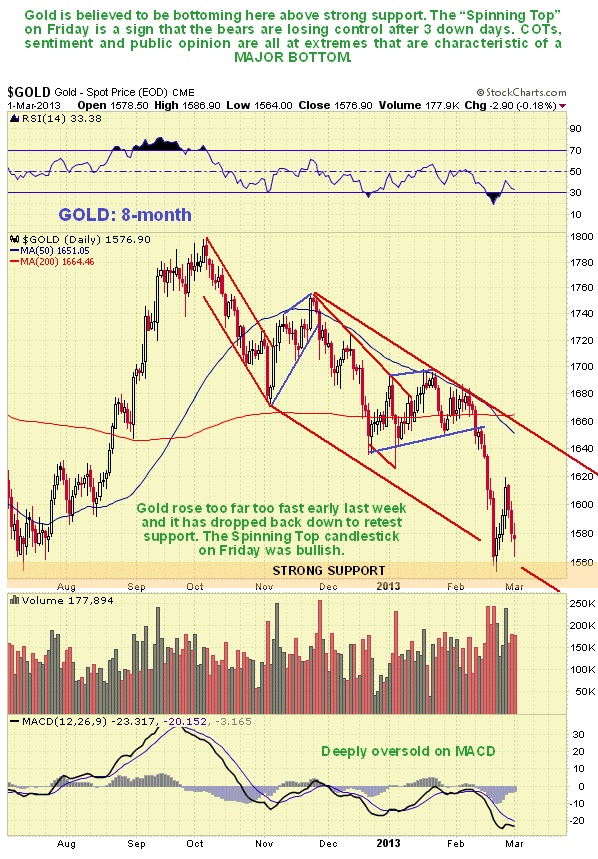
It is interesting to observe a lot of commentators becoming bearish on gold over the past week or two, especially given that it hasn’t even crashed important support and is still in a large trading range. This is just what we want to see before a major rally, since many advisors get caught up in the same gloomy mindset as their clients. We can see that gold still looks alright on its 3-year chart, which simply shows that it is near the bottom of a large trading range after its recent drop. Moving averages are still reasonably well aligned, and the current bunching of its moving averages is what frequently precedes a major rally. In addition volume and volume indicators are still overall positive relative to price, and certainly not negative. One thing that traders should be aware of is that because support at the bottom of this large trading range is so clearly and sharply defined, it is very likely that a large number of stops are clustered just below it, which makes it tempting for Big Money to engineer a false break below this support to run the remaining stalwarts out of their positions ahead of a swift reversal and big rally. They may not bother though because they have already succeeded in squeezing most players out, as the indicators we will come to shortly make plain. Nevertheless it is worth taking this into consideration when deciding where to place stops.

COTs are little changed from last week and still strongly bullish. There was a slight rise in Commercial short positions, but remember this data is of last Tuesday’s close, so this increase was just the Commercials positioning themselves to profit from the 3-day drop that then ensued. It is thus safe to assume that they scaled back their shorts on Friday. Jim Sinclair recently remarked that the COT data may be or is being rigged. We can only comment that so far it has worked well for us, although we are aware that they could set about rigging the COT data, like so much else, if they so decide, although the fact of the matter is that thus far most traders are too lazy and/or stupid to use it, so they probably don’t need to bother. Long may this situation continue!

The gold public opinion chart is an absolute dream for gold longs, or new longs. As we can see on this chart the sheep now hold gold in the lowest esteem for years. You can see how routinely wrong the crowd are on gold just by following the red and green lines we have drawn on this chart. They seem to know their place in the system – their job is to work hard, and when they eventually manage to accumulate some capital, turn round and give it to wealthy people, preferably gift wrapped. Anyway, the current reading is viewed as VERY STRONGLY BULLISH.

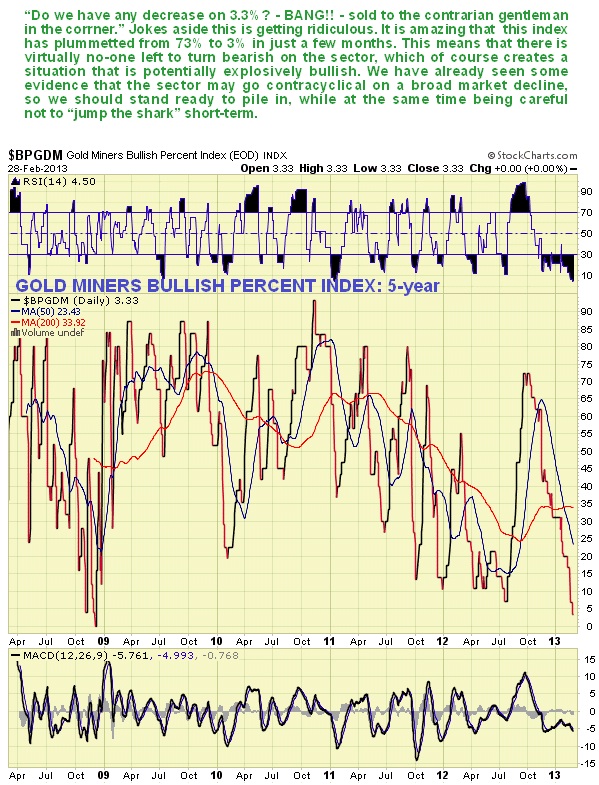
Another indication of a bottom for the sector is the abysmally low reading of the Gold Miners Bullish % Index, which at 3.3% is currently only a shade above its 2008 crash lows. It is astounding that this index has dropped from 73% to 3.3% in just a few months. What is clearly shows is that there is virtually no-one left to turn bearish on the sector, which means it is unlikely that it will drop much more, and the other side of the coin is that the moment buyers do show up in any numbers, it is likely to generate an explosive rally.
What about the dollar and Treasuries? Many gold and silver bulls needed to change their trousers after both the dollar and Treasuries staged breakouts last week. We had thought that there was a good chance of the dollar breaking out upside for some time, and for sure predicted the Treasury breakout , all based on recent COTs and sentiment. The fundamental reason for this development is the renewed crisis in Europe resulting from the indecisive election result in Italy, which foiled the elites’ plan, temporarily at least, to push the bill for the mess that they created onto the ordinary populace via draconian austerity measures. The Italian people are sufficiently fed up that they decided that they would rather be ruled by either a comedian or a philanderer, or both, than by a grey banker, and it has to be said that Berlusconi has a lot more charm than, say, The Godfather. However, it may be going too far to assume that this will lead to another 2008 style market implosion – if they can succeed in somehow papering over the cracks and keeping things limping along, then the dollar and Treasury rally may have a limited life. If the rally does continue to considerably higher levels it would probably trigger a severe decline in the stockmarket, and this time, unlike in 2008, the Precious Metals sector is likely to go contra-cyclical, which it is certainly entitled to since it has already been in contra-cyclical mode for months, but regardless of these considerations, all the indicators that we have considered above are flashing that gold is set to take off soon on a major uptrend.
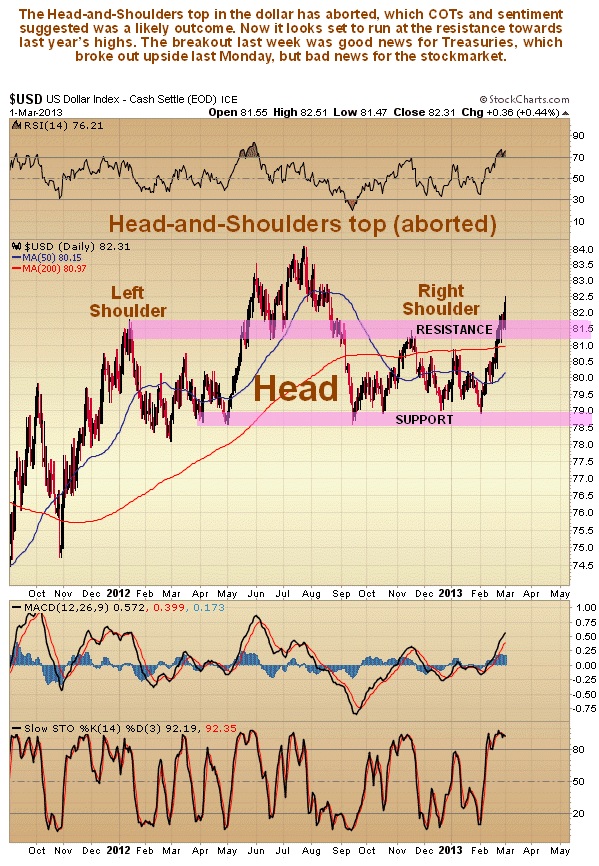
On the dollar index 18-month chart we can see that, having succeeded in aborting its Head-and-Shoulders top by breaking out above the Left Shoulder high, it now looks set to rally at least to the high of the Head of that pattern at about 84, where there is resistance. The dollar’s current good fortune is due to the euro’s current misfortune, and certainly not due to the actions of the Fed, which has been working assiduously to undermine it for years. The dollar’s short and medium-term oscillators are actually getting substantially overbought already, so the 84 area would be a good point to this rally to end, and it is now not so far above the current level.
Public opinion on the dollar has improved dramatically over the past couple of weeks to the point where it is approaching getting excessively positive.

The conclusion to all this is that, regardless of what the dollar and Treasuries do, gold is believed to have bottomed or to be very close to doing so, and to be readying for its next major uptrend that should break it out of its large trading range and take it comfortably to new highs.
Silver Market Update![]()
Clive Maund
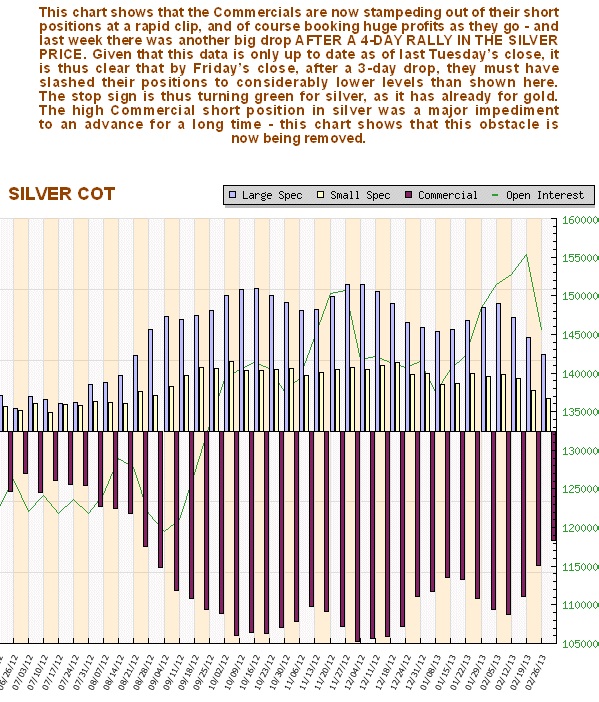
The big story with silver is that the Commercials are continuing to unwind their earlier massive short position at a very rapid rate, and of course booking massive profits in the process. We had pointed out in the last update that until their short positions eased further, silver was likely to back and fill and that’s what happened last week, as after a 4-day rally into Tuesday, silver dropped back for the rest of the week to make a new intraday low on Friday.
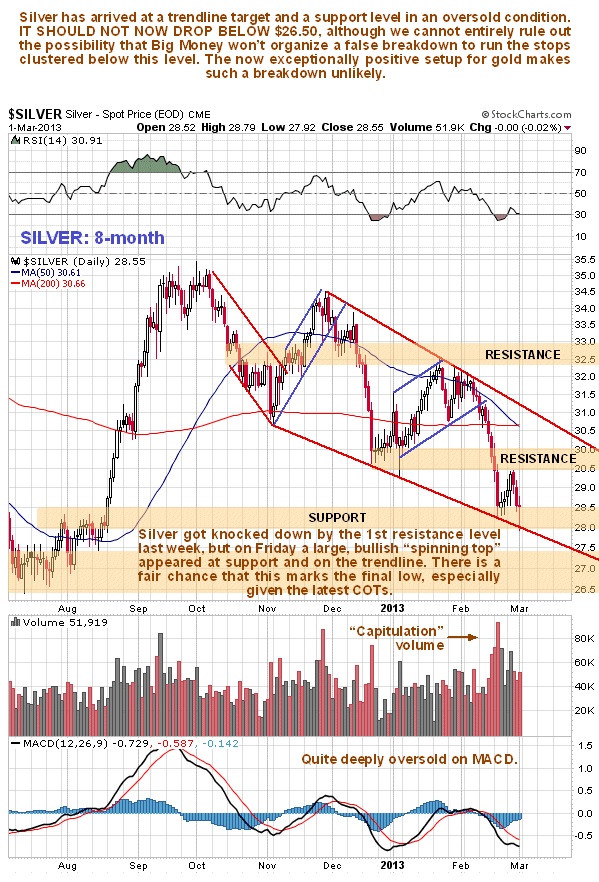
We can see this latest action on the 8-month silver chart below, which shows that after the high-volume capitulation panic low of the preceding week, silver staged a 4-day rally towards a resistance level before turning lower again and heading back to the vicinity of its lows. On Friday it bounced back quite strongly from intraday lows, leaving behind a bullish “spinning top” candlestick on its chart, like gold, which is a bullish sign, especially as it occurred at a support level and at its channel support line – this may mark the final low for this downtrend.
While there has been much bearish talk doing the rounds in recent days and general gloom and despondency, we can see on silver’s 3-year chart that it still looks alright. It HAS NOT broken below the key support at the bottom of its large trading range, and is thus considered (by us) to be in an ongoing large consolidation pattern within its major long-term bullmarket.

The support at the bottom of the large trading range is so clearly defined, so strong and so obvious that we need to be careful regarding the placing of stops. If we can see this you can be sure that Big Money can, so it is just possible that they will run silver briefly below this support to trigger the stops that are clustered beneath it, and mop up all the remaining holdings that they haven’t already netted before a sudden and dramatic reversal back above the support, but the reality is that they don’t really need to do this – they’ve squeezed most people out already, and all the indications are that this support will now hold, especially as the outlook for gold is now so positive.
We mentioned the COTs at the start, so now let’s end by looking at the latest COT chart. While the Commercials’ short positions in gold increased somewhat last week, albeit from a low level, they continued to plunge in silver, which is very good news indeed for silver bulls – and this was despite silver having rallied for 4 days into last Tuesday when this data was last logged. This is a sign that the Commercials are scrambling to book their large profits and get out of the way before a rally starts. When the price dropped again from Wednesday through Friday, you can bet that their short positions were continuing to be closed out for a massive profit at a very rapid rate, resulting in considerably lower readings than are shown on this chart. We can thus allow that Commercial short and Large Spec long positions have dropped back sufficiently to clear the way for a big rally to gain traction before long.
The conclusion to all this is that silver, like gold, is believed to have bottomed or to be very close to doing so, and to be readying for its next major uptrend that should break it out of its large trading range and take it comfortably to new highs. It may have hit bottom on Friday.
Clive Maund, Diploma Technical Analysis
4 March 2013

Clive P. Maund’s interest in markets started when, as an aimless youth searching for direction in his mid-20’s, he inherited some money. Unfortunately it was not enough to live a utopian lifestyle as a playboy or retire very young. Therefore on the advice of his brother, he bought a load of British Petroleum stock, which promptly went up 20% in the space of a few weeks. Clive sold them at the top…which really fired his imagination. The prospect of being able to buy securities and sell them later at a higher price, and make money for doing little or no work was most attractive – and so the quest began, especially as he had been further stoked up by watching from the sidelines with a mixture of fascination and envy as fortunes were made in the roaring gold and silver bull market of the late 70’s.
Clive furthered his education in Technical Analysis or charting by ordering various good books from the US and by applying what he learned at work on an everyday basis. He also obtained the UK Society of Technical Analysts’ Diploma.
The years following 2005 saw the boom phase of the Gold and Silver bull market, until they peaked in late 2011. While there is ongoing debate about whether that was the final high, it is not believed to be because of the continuing global debasement of fiat currency. The bear market since 2011 is viewed as being very similar to the 2-year reaction in the mid-70’s, which was preceded by a powerful advance and was followed by a gigantic parabolic price ramp. Moreover, Precious Metals should come back into their own when the various asset bubbles elsewhere burst, which looks set to happen anytime soon.
Visit Clive at his website: CliveMaund.com


