Gold Market Update - On Point Of Breakout Against The US Dollar
 share
share
 share
share
 share
share
 share
share
 share
share
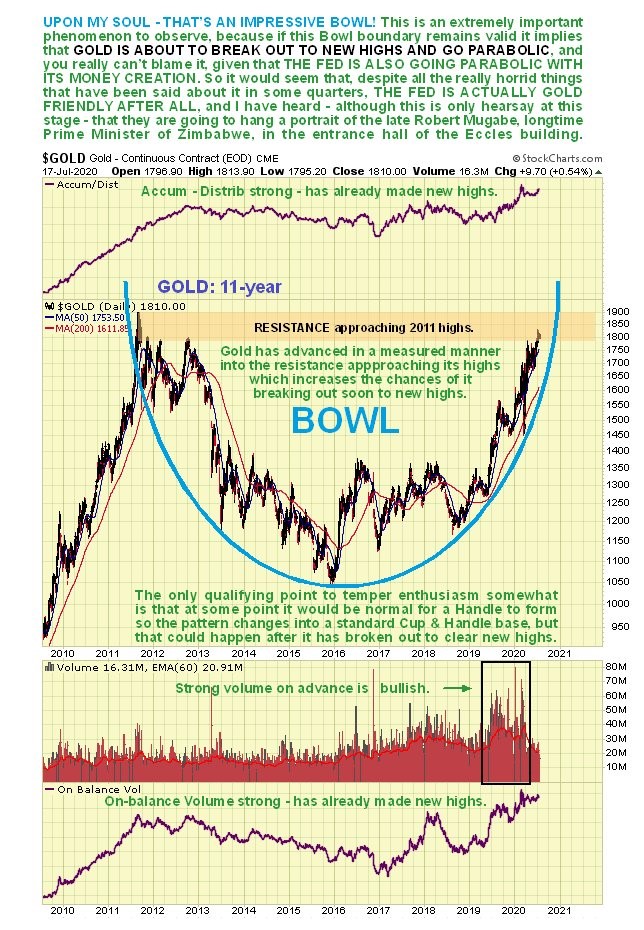
After a measured advance in recent months gold looks on for a breakout to new highs soon. On its latest 11-year chart we can see that, with the Bowl boundary steepening to become near vertical, it could rise very rapidly and very soon, which fits with the most seasonally bullish time of year for gold that we are now entering.
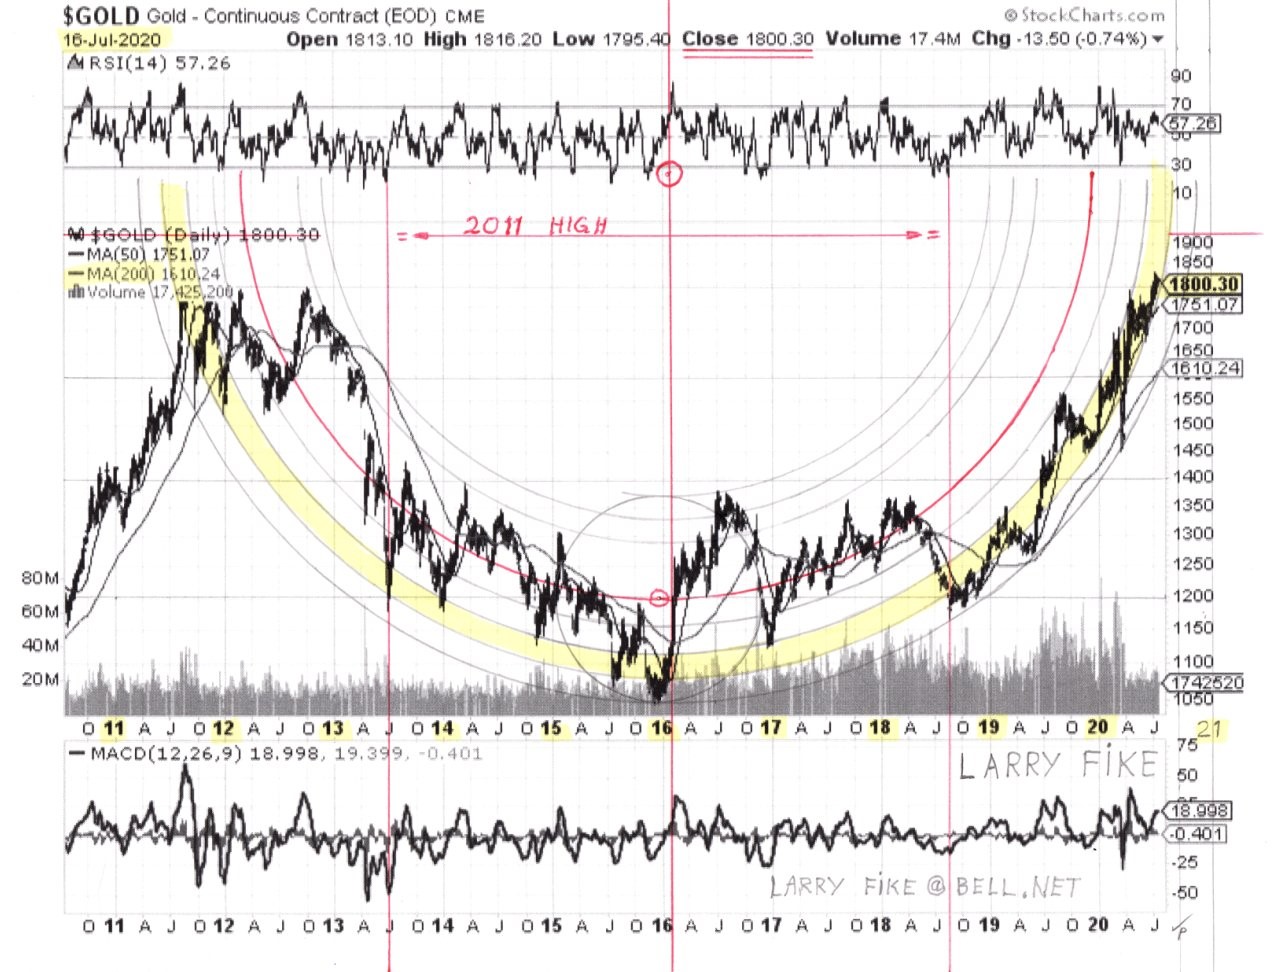
Larry’s stunning gold chart shows the price ascending the extreme right side of a hemispherical Bowl which is now approaching the vertical, and while it could break down to form a Handle to complement the Cup of a potential giant Cup & Handle base, the current extreme situation fundamentally means it is very possible that the pattern will slingshot gold vertically higher in a truly spectacular manner…
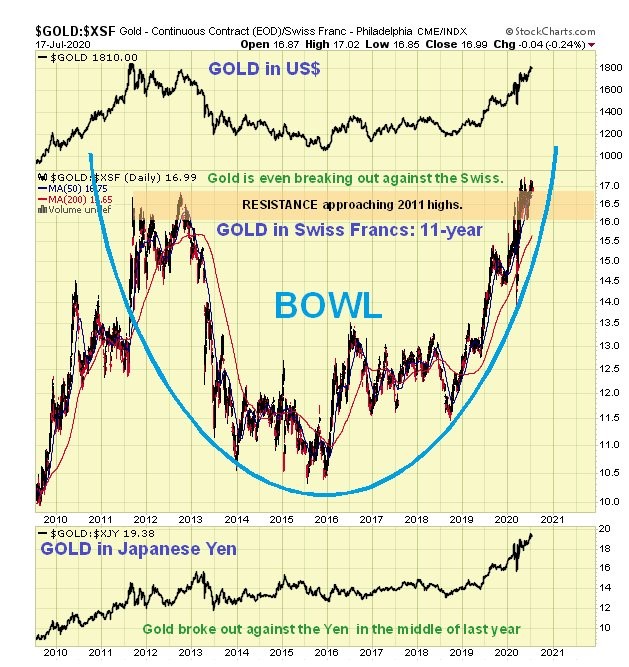
A lot of investors are hung up on whether or not gold can succeed in breaking out to new highs against the dollar, which is why there are still so many bargains to be found amongst gold and silver stocks, even after the recent strong gains in some of them, but the fact is that gold’s major bullmarket is already well established against most major currencies, and it is even breaking out against the Swiss Franc, as we can see on the 11-year in Swiss Francs below. Gold against the Japanese Yen has been added to the bottom of this chart, so that you can see that it is already well on its way against this currency.
The reason that the medium and long-term outlook for gold cannot be any other than extremely positive is simple – Central Banks around the world are creating money at an unprecedented rate in an effort to stave off the threatening deflationary implosion, with pressures to do so being intensified by the current economic collapse caused by the debt overload and quickly made worse by the virus pandemic and the overreaction to it.
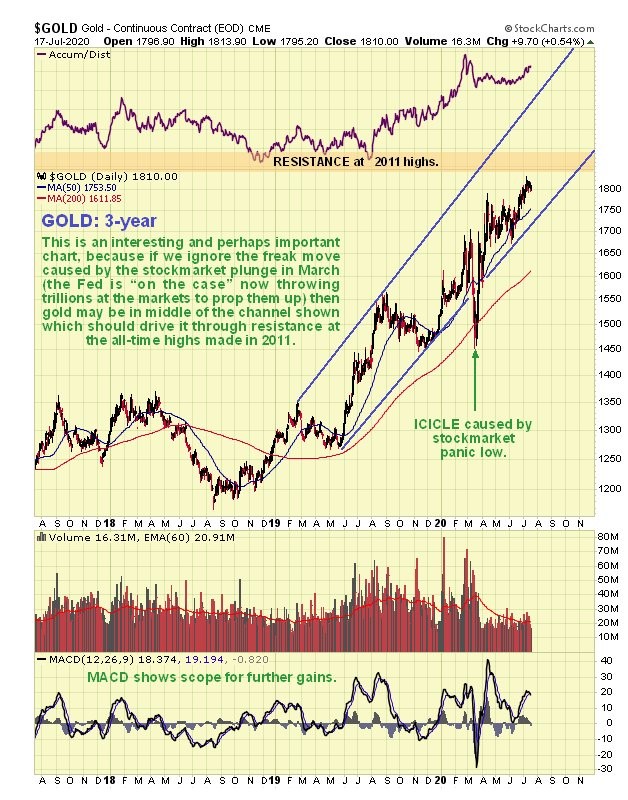
On gold’s 3-year chart we can see that, ignoring the freak drop in March caused by the stockmarket crash, it appears to be ascending within the fairly steep uptrend channel shown that if it holds, should drive gold through the resistance at the 2011 highs to new highs. The measured advance of recent months is believed to be due to its having been working its way through resistance approaching these highs. It is not excessively overbought so a breakout could occur soon, and it is made more likely by the bullish look of many gold stock charts right now.
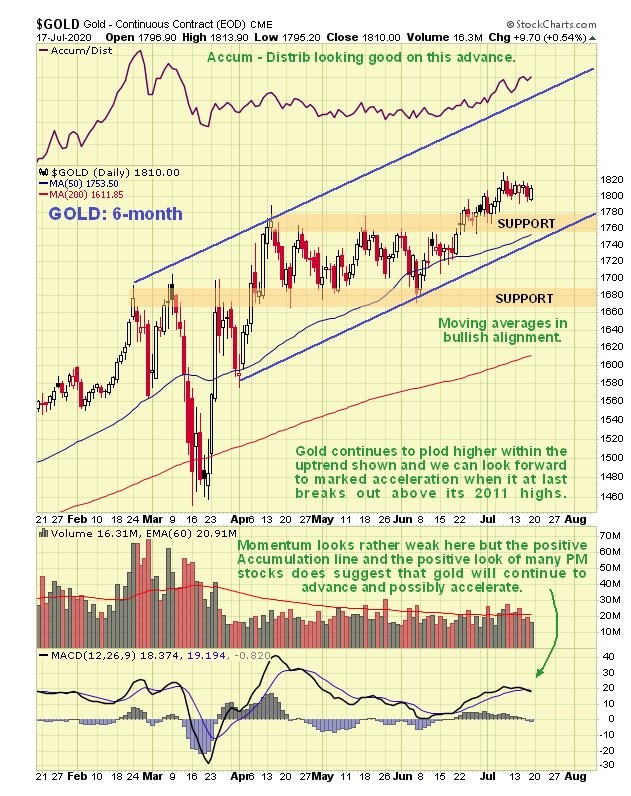
On the latest 6-month chart we can see that gold’s advance following its upside breakout from a trading range last month does look rather weak and hesitant and is not confirmed by momentum (MACD), but on the plus side the Accumulation line certainly looks positive and many gold stocks look like they are on the point of breaking out. About the only thing that could break gold down here would be another deflationary shockwave like we saw in the Spring, but with the Fed continuing to create vast amounts of money to prop everything up and drive stockmarkets higher, this scenario now looks unlikely. One explanation for gold’s plodding performance in the recent past may be that it has been chewing its way through overhanging supply approaching its highs, and that once it has worked its way through it, it could break out to new highs and accelerate away to the upside. This is now made more likely by improving seasonal factors.
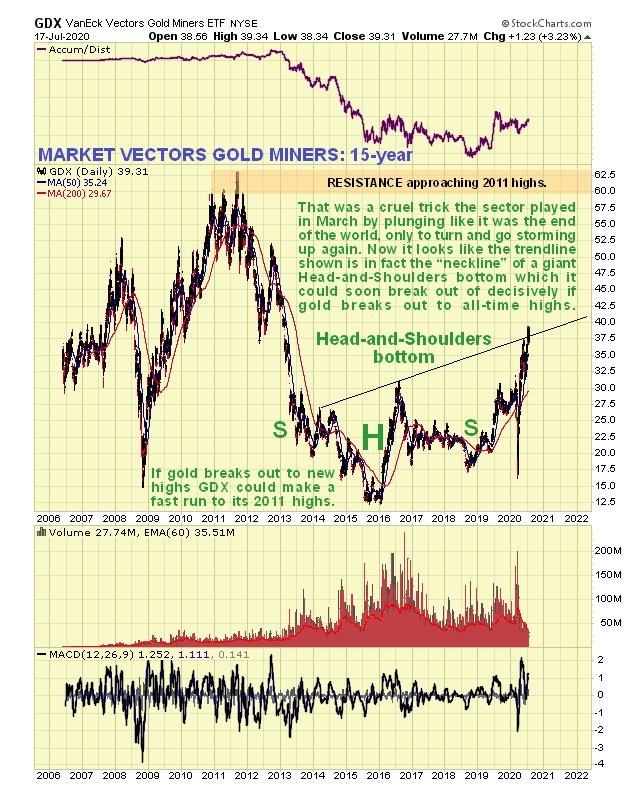
What about gold stocks? While the base pattern on the long-term 11-year chart for GDX is rather messy and hard to define, it best approximates to a Head-and-Shoulders bottom with a quite steeply upsloping “neckline”. If this interpretation is correct then once it has broken out of the pattern which it appears to be on the verge of doing, it could run quite quickly to the vicinity of the 2011 highs.
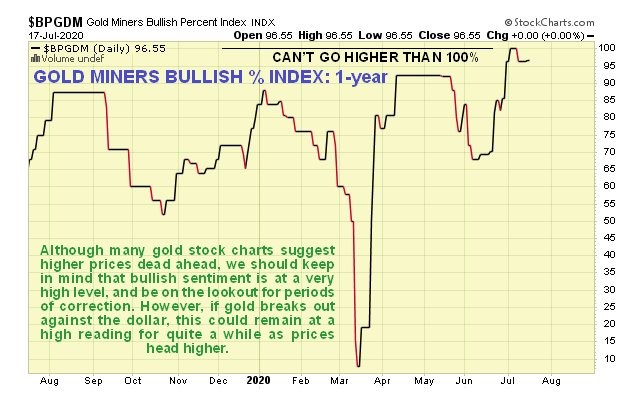
A valid concern with respect to gold stocks at this point is that bullish sentiment is at a very high level. However, if gold is about to break out to new dollar highs, then this bullish sentiment is likely to stay high as the sector advances, with minor corrections causing it to ease modestly. High sentiment levels or not, many gold stock charts, some of which we will be looking at on the site very soon, suggest further gains imminently.
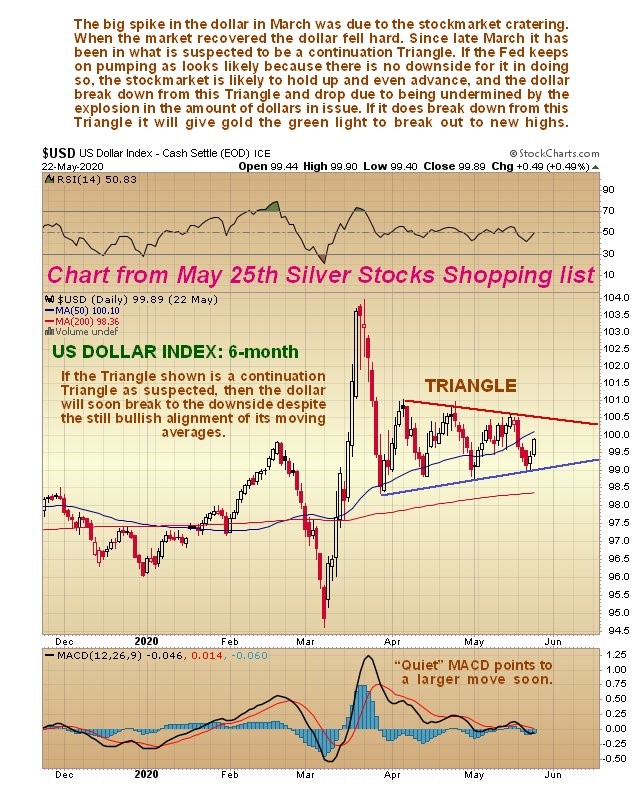
What about the dollar? The prediction made late in May in a Big Silver Stocks Review for a breakdown and drop by the dollar was soon fulfilled. Here is the chart from that article…
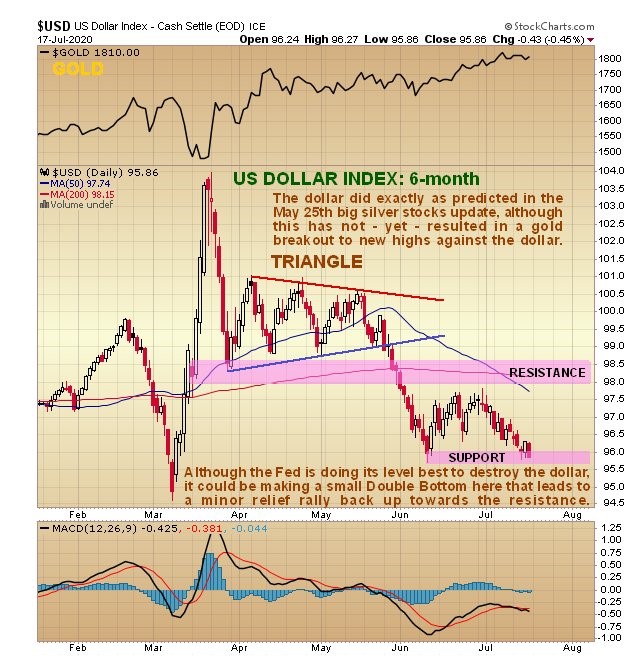
And we can see what happened on the latest 6-month dollar index chart. An immediate significant drop was followed by a relief rally that looks like a bear Pennant. However, the rather hesitant drop that has followed this Pennant hasn’t yet made now lows, so there is some chance that the pattern is turning into a minor Double Bottom, but even if it is, any dollar rally is unlikely to get very far, and it may have little or no effect on gold.
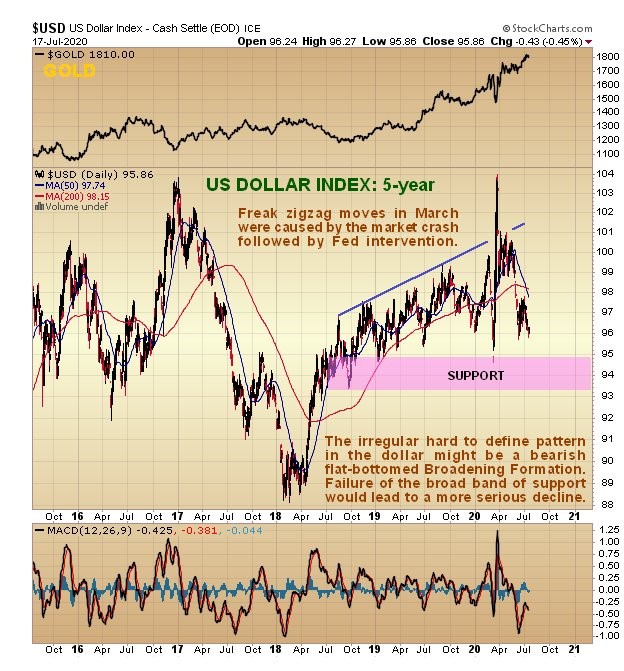
The longer-term 5-year chart for the dollar index looks rather negative, with it appearing to roll over above a broad band of support, so the Fed’s unrelenting efforts to destroy it may soon yield fruit, which would of course be good for gold, although against this we must weigh the fact that other Central banks around the world (which are controlled by the Fed) are also striving to achieve the same.
The Fed’s current money creation binge is set to dwarf all of its previous excesses. Where is most of this newly created money going? It is important to understand that the Fed is completely unaccountable and above the law, i.e. it is a law unto itself. This being so it is able to gift the money it creates to whoever is chooses, be they leading Fed members, favored large corporations or crony associates, usually under the cloak of a small portion of the money going to the masses via stimulus checks etc. It is also able to buy everything in sight, especially and including distressed assets of every description. Someone has to pay for all this distributed largesse of course, and that someone is the ordinary American citizen in the form of raised taxes and much higher inflation. Normally, the fantastic amounts of money created in recent months would quickly lead to a ramp up in inflation, but by killing the economy they have reduced the velocity of money to zero. Now you understand one big reason for the lockdowns whose purpose is to provide the Fed with a time window to “buy up the world” with another reason being to destroy small businesses and the Middle Class so they either have to work for large corporations or live on handouts – either way they lose their independence and become compromised and dependent. This is the reason for the media promoted virus hysteria 24 / 7, a virus that “only” kills about 1% of the population or less and nearly all of those are old folks with other complications, but the lockdowns will end up killing far more as a result of economic privation, stress, depression, starvation and suicides etc.. There is absolutely no reason to force people under 40 or even 50 years old to stay at home or to wear masks, other than the reasons of those in power who want to advance their agendas. The inflation – hyperinflation that ought to result from this huge money creation has not been averted, it has only been deferred by killing the economy, it will out eventually and when it does it will ravage purchasing power and send gold and silver on a moonshot. This is why those of you who have not done so and have the opportunity should make every effort to acquire some physical gold and silver that is in your possession. Silver coins in particular are favored, because there is less risk of government thieves paying you a visit and confiscating them, as is much more likely with gold. Also you can use them if need be for smaller but important transactions. In addition we will continue to highlight promising looking gold and silver stocks on the site.
*********
share
share
share
share
share

Clive P. Maund’s interest in markets started when, as an aimless youth searching for direction in his mid-20’s, he inherited some money. Unfortunately it was not enough to live a utopian lifestyle as a playboy or retire very young. Therefore on the advice of his brother, he bought a load of British Petroleum stock, which promptly went up 20% in the space of a few weeks. Clive sold them at the top…which really fired his imagination. The prospect of being able to buy securities and sell them later at a higher price, and make money for doing little or no work was most attractive – and so the quest began, especially as he had been further stoked up by watching from the sidelines with a mixture of fascination and envy as fortunes were made in the roaring gold and silver bull market of the late 70’s.
Clive furthered his education in Technical Analysis or charting by ordering various good books from the US and by applying what he learned at work on an everyday basis. He also obtained the UK Society of Technical Analysts’ Diploma.
The years following 2005 saw the boom phase of the Gold and Silver bull market, until they peaked in late 2011. While there is ongoing debate about whether that was the final high, it is not believed to be because of the continuing global debasement of fiat currency. The bear market since 2011 is viewed as being very similar to the 2-year reaction in the mid-70’s, which was preceded by a powerful advance and was followed by a gigantic parabolic price ramp. Moreover, Precious Metals should come back into their own when the various asset bubbles elsewhere burst, which looks set to happen anytime soon.
Visit Clive at his website: CliveMaund.com