Gold Price Forecast: Ignoring USD’s Decline Is A Major Signal


 Even though gold “could have, would have, should have” rallied given USD’s decline, it ended yesterday’s session lower. Why? Because it wants to slide.
By. A. Lot.
The decline in the USD Index was huge on a day-to-day basis, and the fact that gold not only ignored it, but actually declined, is truly profound.
In yesterday’s analysis, I commented on gold’s chart in the following way:
Despite Friday’s (Apr. 16) intraday bounce ushering gold back above its late November 2020 low, the momentum faded into the close. And because daily closing prices hold much more weight than intraday volatility, the yellow metal’s inability to hold above its late November 2020 low in terms of the daily closing prices signals that the bearish implications of the breakdown remain intact. Moreover, despite jumping above the upper trend line of its roughly one-and-a-half-month channel, the victory does not override the yellow metal’s inability to hold its November 2020 low or bounce above its April 2020 intraday high.
Please see below:

In addition, gold’s stochastic oscillator is mirroring the behavior that we witnessed in early 2021. If you analyze the bottom area of the chart above, you can see that the indicator recorded three material moves higher (triple top) before gold eventually rolled over.
In particular, the first sell signal occurred slightly below the 80 level, the second was above it, and the same was the case with the third one. The stochastic indicator is already above the 80 level right now, so it seems natural for one to expect a top any day – or hour – now.
Since back in early 2021, the stochastic indicator moved to new highs – and so far it hasn’t – and since the USD Index might even move slightly lower before finding its short-term bottom, gold could move slightly higher on a temporary basis, before topping. Perhaps (there are no certainties on any market, but this seems quite possible in the near term) it would be the round nature of the $1,800 level and the 300-day moving average that’s very close to it that would trigger a reversal and another massive decline. From the medium-term point of view, another $20 rally doesn’t really matter. It’s the few-hundred-dollar decline that’s likely to follow that really makes the difference.
Thus, if history rhymes once again, another sharp reversal could be in order either immediately or soon.
The stochastic indicator has just moved to new highs, just like it did in early 2021. This, plus gold’s extremely weak performance compared to the situation in the USD Index and the fact that the latter is likely very close to forming a major bottom, makes the outlook very bearish for gold.
Let’s keep in mind that the move to $1,800 is just a possibility, not something to be expected, let alone something necessary for gold to decline. Gold just showed that it’s ready to slide even without USD’s help.
In fact, in today’s pre-market trading, the USD Index moved to new lows, while gold moved slightly lower as well. Yesterday’s performance doesn’t seem to be anything accidental but rather something truly bearish.
Speaking of the USD Index, in yesterday’s analysis, I commented on its chart in the following way:
In addition, let’s keep in mind that the very bullish analogy to the 2018 rally remains intact. If you analyze the chart below, you can see that back in 2018, the USD Index rallied sharply and then corrected back to its previous highs. And in similar fashion, the current weakness is nearly identical. More importantly, though, with the 61.8% Fibonacci retracement level sitting just below the USD Index’s 50-day MA, the cavalry is already on the way.
Please see below:
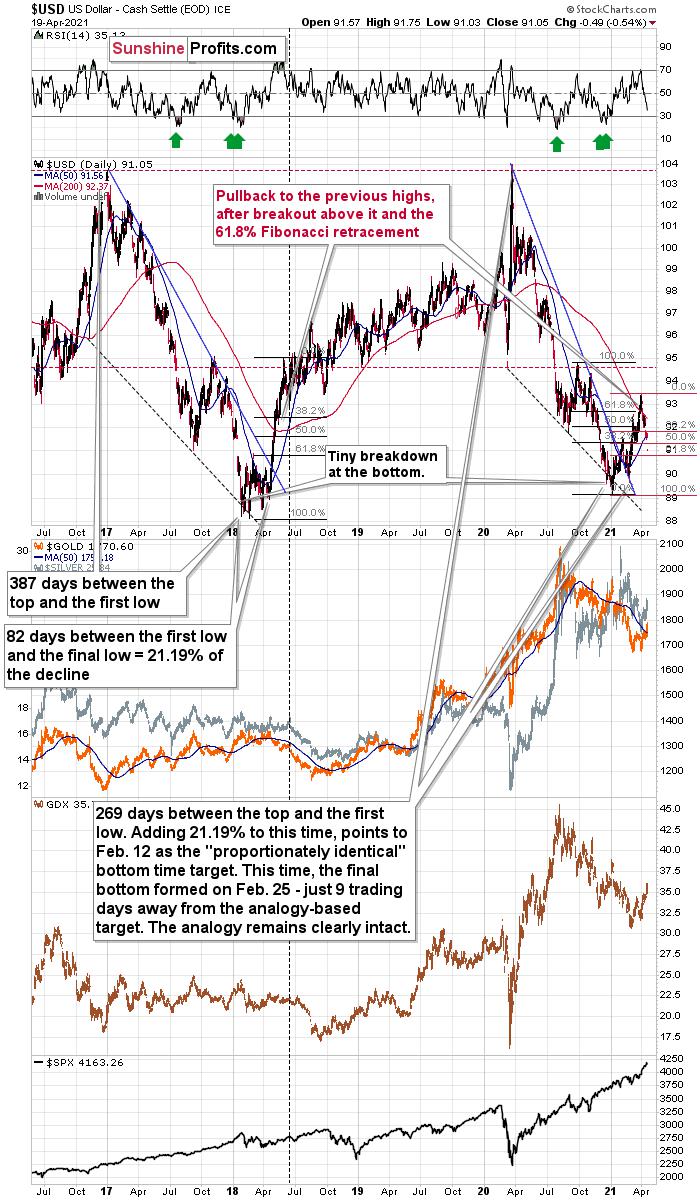
The current correction is much bigger than what we saw in mid-April 2018, so it seems that what we see right now is more of an analogy to what we saw in June 2018. That was the first big correction after the breakout – above the 50-day moving average and the declining blue resistance line – that definitively ended the yearly decline.
I marked the situation from 2018 that seems similar to what we see right now with a dashed, horizontal line. Back in 2018, the pullback ended when the USD Index moved to its first Fibonacci classic retracement level (the 38.2% one). In case of the current rally, I marked those retracements with red. The USD Index is already below the first two (taking today’s pre-market decline into account) and it seems to be on its way to reach the final – most classic – 61.8% retracement. This kind of retracement provides substantial short-term support and it’s something that’s likely to trigger a rebounding.
This retracement is slightly above the 90.7 level, and at the moment of writing these words, the USD Index is trading at 91.14. This means that the USD Index can reach its very strong short-term support any day – or hour – now.
The very important detail about the June 2018 decline (and bottom) is that while this was the moment after which the USD Index’s started to move higher at a slower pace, it was also the moment after which the precious metals market started to decline faster.
At the beginning of the year, I wrote that the precious metals market was likely to decline and that the preceding rally was likely fake. That’s exactly what happened.
Right now, I’m writing that the recent rally was also fake (a correction within a medium-term decline) and – even more importantly – it seems likely that the next downswing could take place at a higher pace than what we saw so far this year. And – just as was the case in 2018 – this upcoming (fast) decline is likely to lead to the final bottom in the precious metals sector.
And here’s what happened yesterday and in today’s pre-market trading:
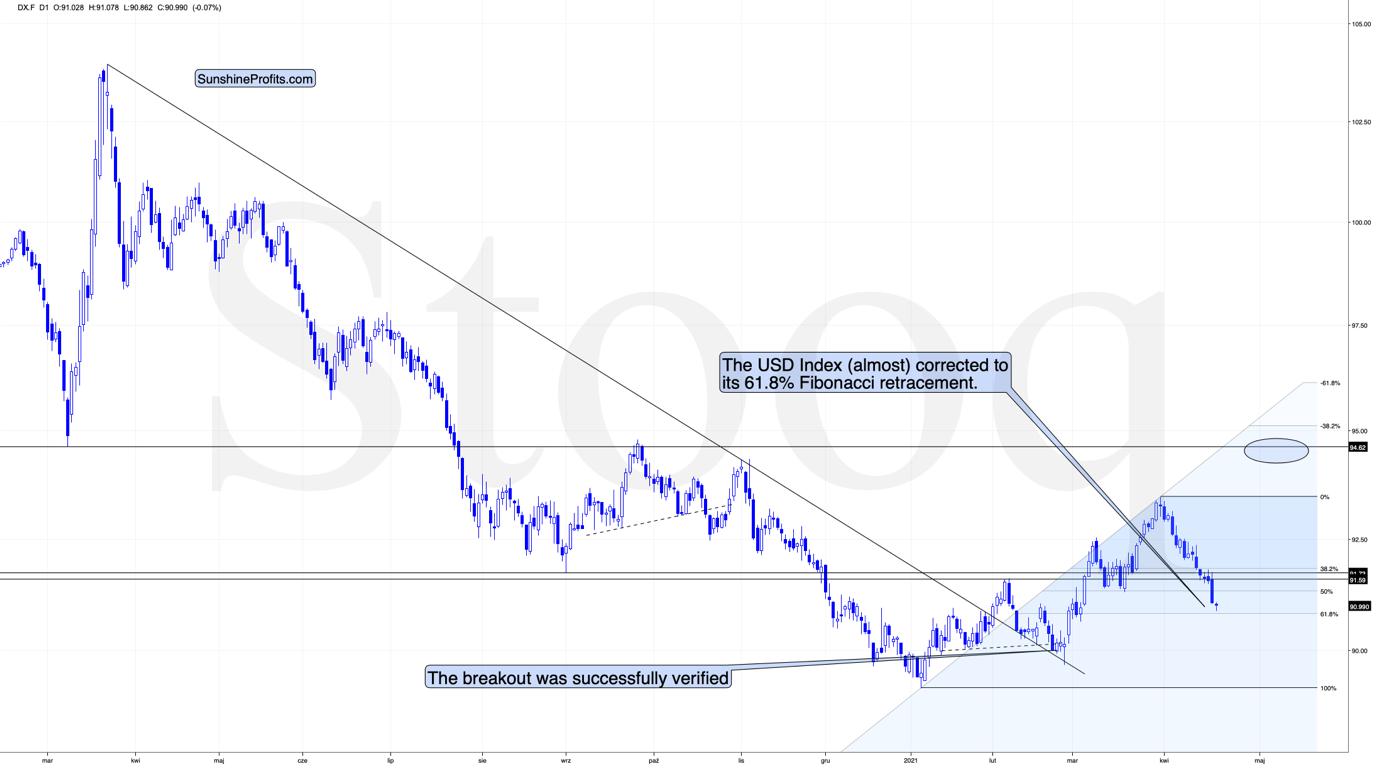
Today’s intraday low (at least so far) is 90.86, which is very close to the above-mentioned strong support provided by the 61.8% Fibonacci retracement. With this support being at hand, it seems that the bottom is already in, or about to be formed. The top in gold, however, seems to be already behind us, given how weak gold was during USD’s decline.
And what about mining stocks? In short, my yesterday’s comments on them remain up-to-date:
With the GDX ETF attempting to regain its former glory, the senior miners breathed a sigh of relief after breaking above their declining resistance line (the blue line below). However, mirroring the zigzag pattern that we witnessed in late 2020/early 2021, on Apr. 16, the GDX ETF hit the upper trend line of its roughly one-and-a-half-month channel. More importantly though, the development ended the GDX ETF’s rally in early 2021 and ended up being a prelude to the senior miners’ material fall from grace.
Please see below:
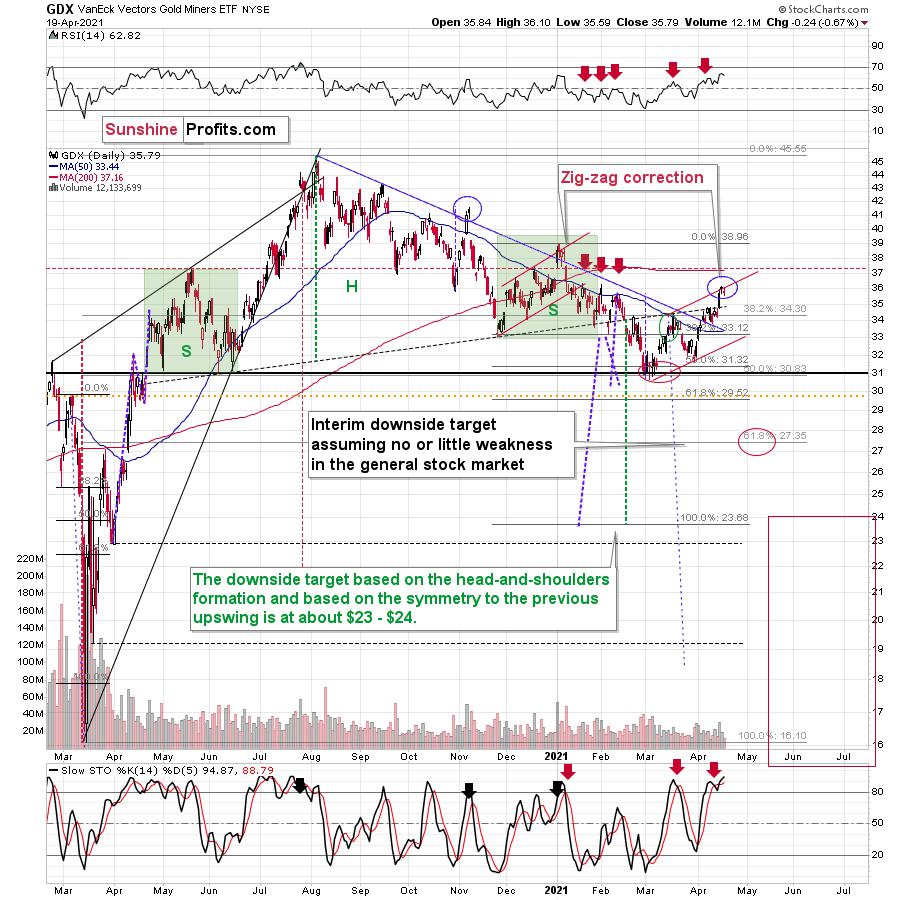
Moreover, the GDX ETF’s rally above its declining resistance line is a classic example of ‘been there, done that.’ Case in point: back in November 2020 and January 2021, the GDX ETF managed to peak its head above the aforementioned blue line. However, shortly after declaring victory, the senior miners suffered severe drawdowns. As a result, the current move is nothing to write home about.
In addition, if you analyze the vertical blue dashed line above – connecting the peak-to-trough price action in October/November 2020 – you can see that the magnitude of the correction also mirrors the current swoon. What’s more, the final two days of the November rally culminated with the GDX ETF moving sharply higher on Thursday and slightly higher on Friday. And following the same script, the GDX ETF’s sharp rally on Thursday (Apr. 15) was followed by a tepid bounce on Friday (Apr. 16). Thus, the technicalities of other markets, technicalities of mining stocks, the futures’ traders’ positions, and historical precedent are all signaling a material reversion.
Still, I would like to point out that it’s still possible that the head-and-shoulders formation that I marked previously was not THE formation that is going to take mining stocks to much lower prices. It could be the case that the left shoulder is as I described previously, but that the head of the pattern is bigger and the right shoulder is being formed right now. If this is the case, then we might still see the GDX ETF at about $37 level or so before it really slides. This would be in tune with how the situation developed in 2008 and 2012 – you’ll find details of this comparison in the following part of the analysis, where I discuss the HUI Index’s very long-term chart. For now, let’s keep in mind that even a rally slightly above $37 in the GDX ETF would not invalidate the bearish outlook for mining stocks (even though it would feel very unpleasant in the short term).
Still, it could be the case the initial head and shoulders pattern is going to hold anyway. As further evidence on this (more bearish in the short term but just as bearish in the medium term) scenario, let’s take a look at other proxies for the mining stocks. When analyzed through the lens of the GDXJ ETF, the pattern is far from invalidated. Case in point: the GDXJ ETF has yet to break above the neckline of its bearish H&S pattern.
Please see below:
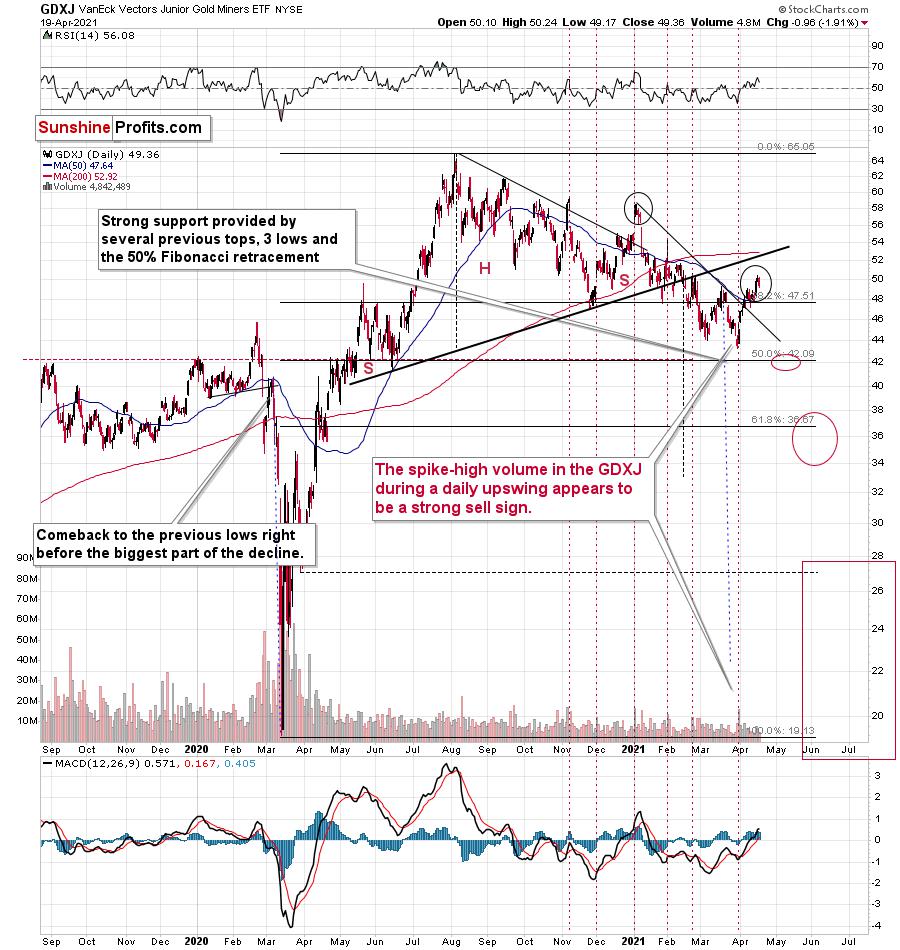
To explain, the GDXJ ETF is relatively far from the neck level (which I marked with a thick, black line). On a side note, the breakout that we saw recently (above the short-term declining resistance line) seems similar to the breakout that we saw in January – above the line that was important back then. Just as the January strength turned into declines, I expect to see the same thing this time.
The thing I would like to do today is to put emphasis on the relative weakness of the GDXJ compared to the GDX. During yesterday’s session the GDXJ moved below its March highs while the GDX didn’t, and the overall daily decline in the GDXJ was about 3x bigger. This tells me that the decision to focus on the GDXJ instead of the GDX in the current short trade was likely a correct one. Just like it was the case last year, junior miners are declining more than senior miners are, and this is likely to get even worse when the general stock market declines in a substantial way.
Summary
Based on gold’s relative (lack of) strength compared to the movement in the USD Index, it seems that the top in the former is likely in or about to be in.
After gold’s short-term rally it’s very easy to be bullish on it, but let’s keep in mind that what’s profitable is rarely the thing that feels good initially. Based on many indications, also including those mentioned above, forecasting gold’s longer term rally without a bigger decline first is thus likely to be misleading. Silver is likely to slide as well. The times when gold is continuously trading well above the 2011 highs will come, but they are unlikely to be seen without being preceded by a sharp drop first.
Thank you for reading our free analysis today. Please note that it is just a small fraction of today’s all-encompassing Gold & Silver Trading Alert. The latter includes multiple premium details such as the outline of our trading strategy as gold moves lower.
If you’d like to read those premium details, we have good news for you. As soon as you sign up for our free gold newsletter, you’ll get a free 7-day no-obligation trial access to our premium Gold & Silver Trading Alerts. It’s really free – sign up today.
Przemyslaw Radomski, CFA
Founder, Editor-in-chief
Sunshine Profits - Effective Investments through Diligence and Care
* * * * *
All essays, research and information found above represent analyses and opinions of Przemyslaw Radomski, CFA and Sunshine Profits' associates only. As such, it may prove wrong and be subject to change without notice. Opinions and analyses are based on data available to authors of respective essays at the time of writing. Although the information provided above is based on careful research and sources that are deemed to be accurate, Przemyslaw Radomski, CFA and his associates do not guarantee the accuracy or thoroughness of the data or information reported. The opinions published above are neither an offer nor a recommendation to purchase or sell any securities. Mr. Radomski is not a Registered Securities Advisor. By reading Przemyslaw Radomski's, CFA reports you fully agree that he will not be held responsible or liable for any decisions you make regarding any information provided in these reports. Investing, trading and speculation in any financial markets may involve high risk of loss. Przemyslaw Radomski, CFA, Sunshine Profits' employees and affiliates as well as members of their families may have a short or long position in any securities, including those mentioned in any of the reports or essays, and may make additional purchases and/or sales of those securities without notice.
********
 Przemyslaw Radomski, CFA, is the founder, owner and the main editor of SunshineProfits.com. You can reach Przemyslaw at: http://www.sunshineprofits.com/help/contact-us/.


