Gold Price Forecast: Key Message For Gold


 Last week's trading saw gold forming its low in Tuesday's session, here doing so with the tag of the 1723.20 figure (June, 2021 contract). From there, a sharp rally was seen into late-week, with the metal running all the way up to a Friday peak of 1784.70 - also managing to end the week at or within earshot of the same.
Gold's Short-Term Picture
As mentioned last weekend, the last short-term correction phase for gold was expected to come from our 10-day cycle, which is shown again on the chart below:
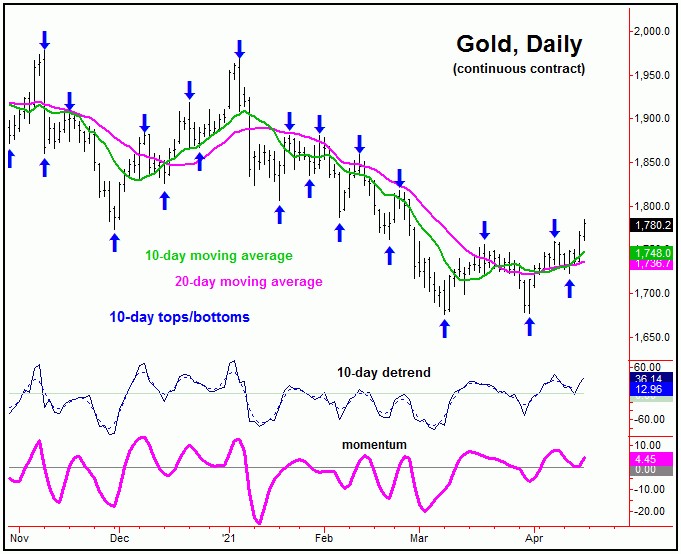
Our expectation was that the last decline with this smaller 10-day wave would see the 10-day moving average acting as the magnet - but would also end up as a countertrend affair, holding above the 1677 swing bottom.
This did end up as the case, with the metal bottoming with last Tuesday's tag of the 1723 figure - and, with the following action, we were able to confirm the next upward phase of this 10-day wave to be back in force. This was suggested to be the real 'breakout' point to the upside for gold, due to the position of the larger 34 and 72-day cycles. Shown below is the smaller 34-day component:

The position of one cycle will often tell us what to expect with the wave of a smaller degree. As mentioned above, with this larger 34-day wave pointed UP, the recent correction phase of the 10-day cycle was expected to end up as a countertrend affair, to be followed by higher highs on the next swing up - which we are in now in.
In terms of time, our smaller 10-day wave is only 3 trading days along to the upside. With the configuration of the larger 34 and 72-day cycles, the probabilities should favor additional strength in the coming days. In terms of time, the ideal path is looking for a right-translated 10-day cycle upward phase - one that peaks on or after the 5 day mark.
The chart below shows the larger 72-day wave:
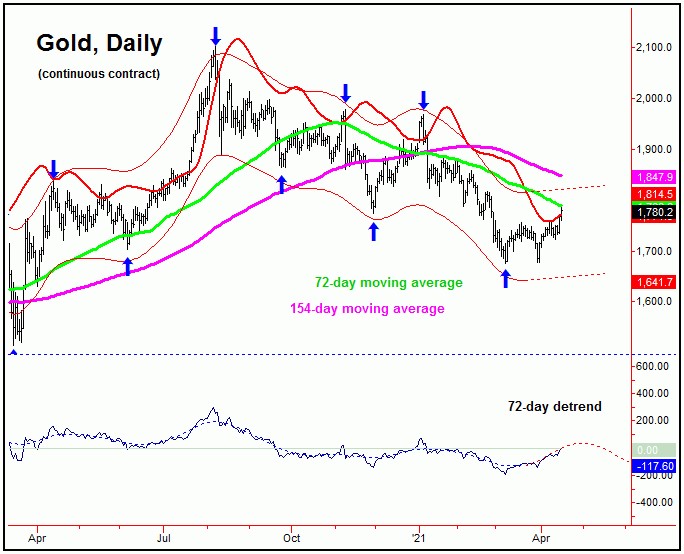
As mentioned in recent articles, this 72-day cycle was moving into bottoming territory, with the next decent rally phase expected to come from the same. In our Gold Wave Trader report, we were able to confirm its low to be set in place - which, in turn, favored additional strength, with the 72-day moving average acting as the ideal minimum magnet.
'Rare' Signal for Gold, Revisited
Going further with the above, back in early-March I noted a rare signal had formed with the gold market. That signal came from our 72-day 'oversold' indicator, which is shown in red on our 72-day cycle chart:
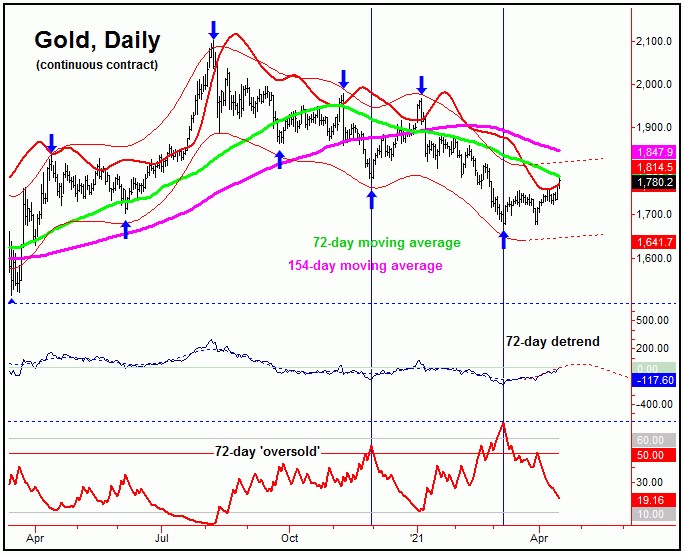
This rare signal occurred when our 72-day 'oversold' indicator spiked back above its upper reference line. Spikes above this line do not happen often - perhaps only 1-3 times per year. And - as long as the metal is not in the midst of a raging bear market - these signals nearly always come at or near market lows.
On the 72-day chart I have noted with the blue vertical lines each of the occurrences of this indicator spiking above its upper reference line, with the most recent instance coming back in early-March - right at the last key bottom for the metal. Prior to that, the last occurrence came back at the late-November, 2020 trough - which gave way to the sharp rally that was seen into early this year.
Adding to the notes above, the rally off the November, 2020 lows obviously failed earlier this year, with the rally stopping dead when our 72-day 'oversold' indicator spiked back below its lower reference line. We are working our way back to this lower reference line now.
Having said the above, there is a key difference with the current rally, vs. the one that came off the November, 2020 trough. That difference is shown on the chart below:

The chart above shows our Mid-Term Breadth index for the gold market, which we update regularly in our Gold Wave Trader report. Of honorable mention is that, following the November, 2020 trough, this indicator was never able to move above its 'zero' reference line, stopping just short of the same.
At the present time, however, we note that our Mid-Term Breadth index has recently pushed back above its zero line. As mentioned in my prior article, moves above this line have often been accompanied by sharp rallies in gold - which we have obviously seen with the action into last week. Going even further, the current move above the zero line came off a divergent bottom with this indicator vs. price - which is even more telling, and is something often seen near key longer-term bottoms.
The Bottom Line
The overall bottom line with the above is that gold formed a key short-term low with the 72-day cycle back in early-March, with the upward phase of this wave now firmly in force. Going further, with the overall action of technicals, there is now the potential for a much larger-degree low to have formed, though we are currently awaiting confirmation of the same. Once triggered, we are expecting the largest percentage rally of this year to play out in the months to follow - as the next bull market phase of gold assumes control. Stay tuned.
Jim Curry
The Gold Wave Trader
http://goldwavetrader.com/
http://cyclewave.homestead.com/
*********


