Gold Price Forecast: Looking For Short Term Low


 Recapping Last Week
Last week's action saw gold spiking higher into Tuesday's session, here running all the way up to a peak of 1810.60. From there, however, a sharp decline was seen into later in the week, with the metal dropping down to a Thursday low of 1745.50 - before bouncing slightly into Friday.
Gold, Short-Term Picture
For the near-term picture, as mentioned last weekend the downward phase of the 10 and 20-day cycles was deemed to be in force for the gold market, with the next short-term bottom expected to come from the same.
The chart below again shows the smaller 10-day wave:

From last weekend: "Support to the current correction phase looks to be at or into the 1738-1776 region, which encompasses the 38-61% retracement of the prior swing up, but with a key focus on the 1757-1776 level inside this range. In terms of time, the next key date range of focus is the September 15-16 reversal date area, which - if lower lows are seen into the same - may be primed to bottom the smaller swing down."
As mentioned last weekend, there was some focus on the September 15-16 timeframe to bottom the 10 and 20-day cycles, with support to the same at or into the 1738-1776 region (December, 2021 contract). So far, the lowest low has came in on September 16th, doing so at the 1745.50 figure.
With the above said and noted, the next short-term low is now due to materialize with the 10 and 20-day waves. With that, we are looking for a push above an upside reversal level in the days ahead to confirm an upturn in the same, with more precise details posted in our Gold Wave Trader market report.
Stepping back slightly, once the next trough does form with the 10 and 20-day cycles, then the probabilities should favor a nice short-term rally phase, one which takes gold back to its 10-day moving average, at minimum, though with a rally back to the higher 20-day moving average being more ideal.
With the recent daily close back below the 1756.00 figure (December, 2021 contract), the probabilities will now favor the next rally phase with the 10 and 20-day cycles to end up as a countertrend affair, holding below the 1836.90 swing top. If correct, lower lows should continue to play out into the late-October timeframe, where the next 154-day trough is projected to materialize:
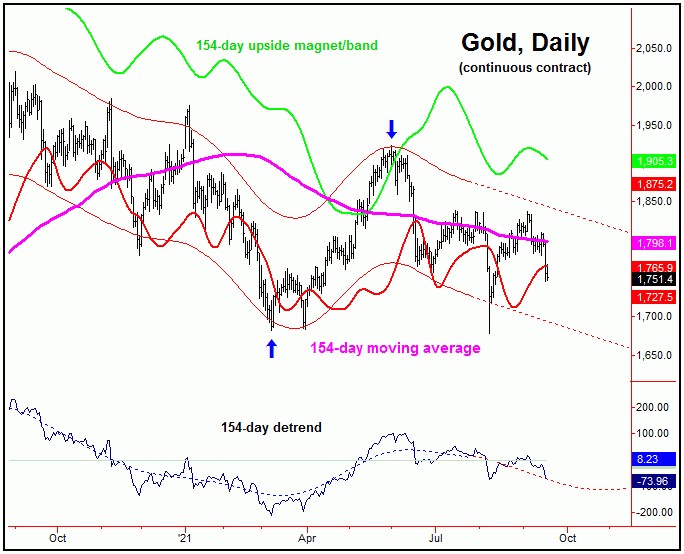
With the above said and noted, lower lows into the late-October timeframe or later - if seen as expected - should end up forming our next larger bottom, expected to come from this 154-day time cycle. As to what price level will bottom the downward phase of this wave is up in the air, though there is the decent potential for a spike on down to the low-end 1600's before this wave attempts to trough.
Stepping back further, from whatever low that does form with this 154-day cycle into early-Autumn, the probabilities will favor a sharp rally of 20% or more playing out into what looks to be first few months of next year. That rally should see the upper 154-day cycle band acting as the ideal magnet; that band could also act as a key level of mid-term resistance for the metal.
U.S. Stock Market (Update)
Back in mid-August, I mentioned a key topping date for U.S. stocks was coming due. In our daily Market Turns outlook (which covers the U.S. stock market), we noted this date as being September 1st, which is shown on the chart below:

There have been three key topping dates for U.S. stocks this year, each of which are shown in the above chart. The last turn - set for September 1st - came within just one trading day of the September 2nd price peak. From there, the SPX (i.e., the S&P 500 index) has seen a very sharp decline, though nothing yet of the magnitude of some of the corrections seen earlier in the year.
Even with the above, there is still more time left for additional correction to play out on the SPX, with the next low of significance not expected to form prior to the late-September to early-October period. This is where the next bottom is projected with the 90-day time cycle, shown on the chart below:
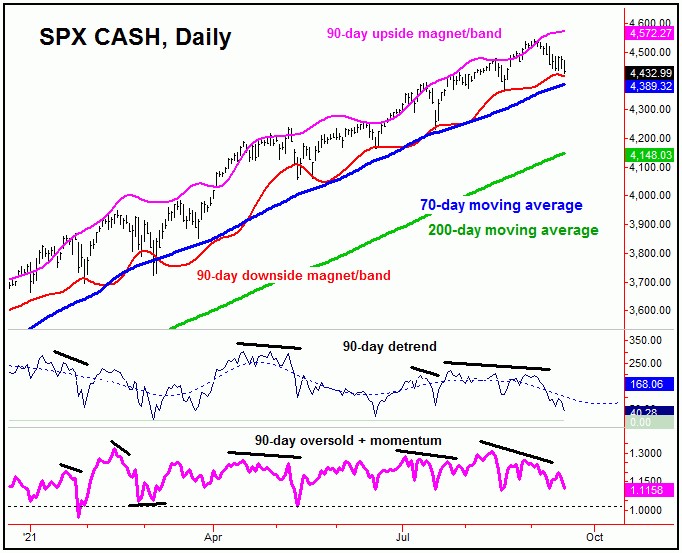
Having said the above, as mentioned in some prior articles, there are two bigger cycles which are also due to bottom out into the Autumn of this year, the 180 and 360-day waves. However, we have yet to actually confirm a downturn in these two cycles, which would currently require a daily close back below the 4367.73 SPX CASH figure - making this a key number to watch in the days ahead.
In terms of time with the above, we have a new key date for the next good swing low to develop on the SPX, with the exact details noted in our daily Market Turns report. From whatever low that does form in the coming weeks, the probabilities will favor a minimum rally of 13% or more playing out into later this year, which is the statistical average for a 90-day cycle upward phase. Stay tuned.
Jim Curry
The Gold Wave Trader
http://goldwavetrader.com/
http://cyclewave.homestead.com/
********


