Gold Price In India: Stronger Rupee Pushed Gold Lower


Yesterday, the Indian rupee rose to a two-week high as expectations for a narrower trade deficit and receding concerns about Syria helped the currency continue its recent recovery from record lows hit last month. Today, the Indian currency extended gains and added as much as 1.52%. It’s worth noting that the rupee posted a fifth consecutive session of gains after former International Monetary Fund Chief Economist Raghuram Rajan took the helm of the central bank last Wednesday and quickly unveiled a spate of measures to support the currency and open up markets.
According to Reuters, Rajan's appointment has sparked badly-needed optimism among investors, after the rupee had slumped over 20 percent so far this year, as markets hope for a fresh approach to the new RBI's controversial defense of the rupee.
Since August 28 the rupee has gained more than 6%. What impact did this have on the gold's chart? Where are the nearest support zones and resistance levels? Let's take a closer look at the daily chart and find out what the current outlook for gold priced in rupees is.
On the above chart we see that the situation has deteriorated since my previous essay was published.
Quoting my previous essay on gold in India from September 6:
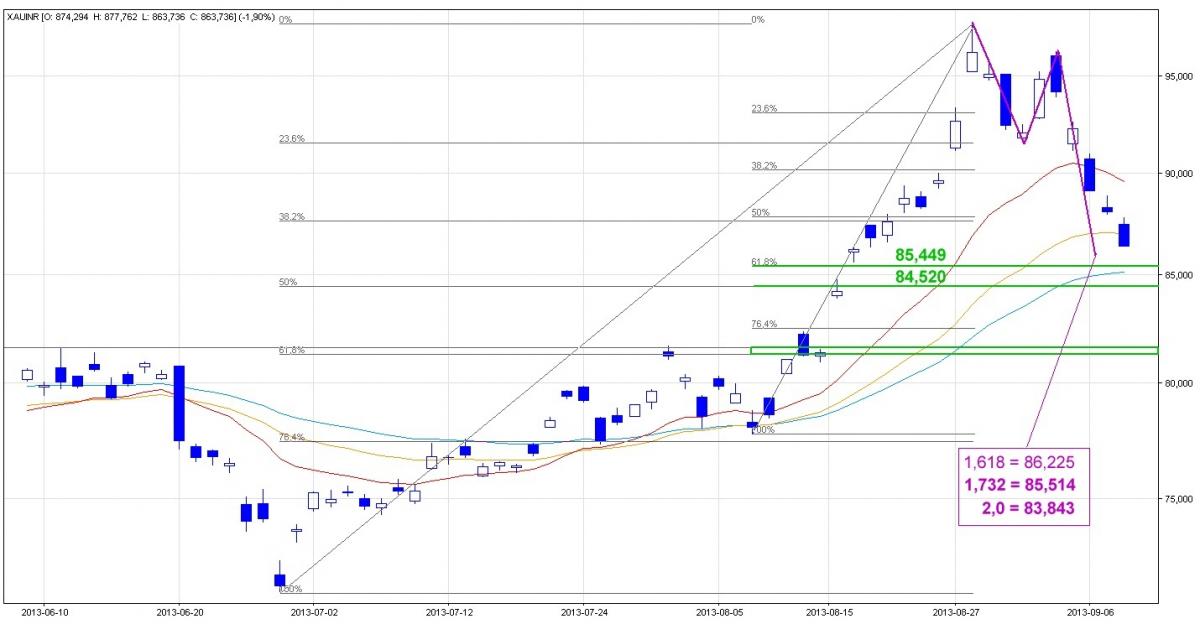
(…) the recent corrective move is a bit larger than the previous one. This means that it can extend in the following days. In this case, the 1.272 ratio is around Rs 88,382, and the next one (the 1.414 ratio) is close to Rs 87,497. It’s worth noting that this ratio is slightly below the 38.2% Fibonacci retracement level, and together they form a strong support zone which, from today’s point of view, seems to be the first price target for the sellers.
As you see on the daily chart, since the beginning of this week gold bears have shown their claws and pushed the price of gold lower. Today, they witnessed the scenario outlined above since the yellow metal dropped below the 38.2% Fibonacci retracement level based on the entire June-August rally and reached Rs 86,200 per ounce (around 27,806 per 10g). Additionally, today the price of gold also slipped below the 30-day moving average, which serves as resistance now.
Taking the above into account you are probably wondering what’s next?
When we factor in the Fibonacci price projections (purple lines on the chart), we see that the 1.618 ratio was broken today. If the gold bulls don’t manage to push the price higher from here, the next price target for the sellers will be around the 1.732 ratio at Rs 85,514. It’s worth mentioning that this ratio is slightly above the 61.8% Fibonacci retracement level based on the upward move from the August low to the August top (around Rs 85,449 per ounce). This area is also supported by the 45-day moving average (currently at Rs 85,090).
If this strong support zone is broken, the next support level will be close to the 50% Fibonacci retracement level based on the entire June-August rally.
Once we know the current situation in gold priced in rupees, let’s take a look at the INR/USD chart and find out whether the relationship between gold and the INR/USD exchange rate still exists or not.
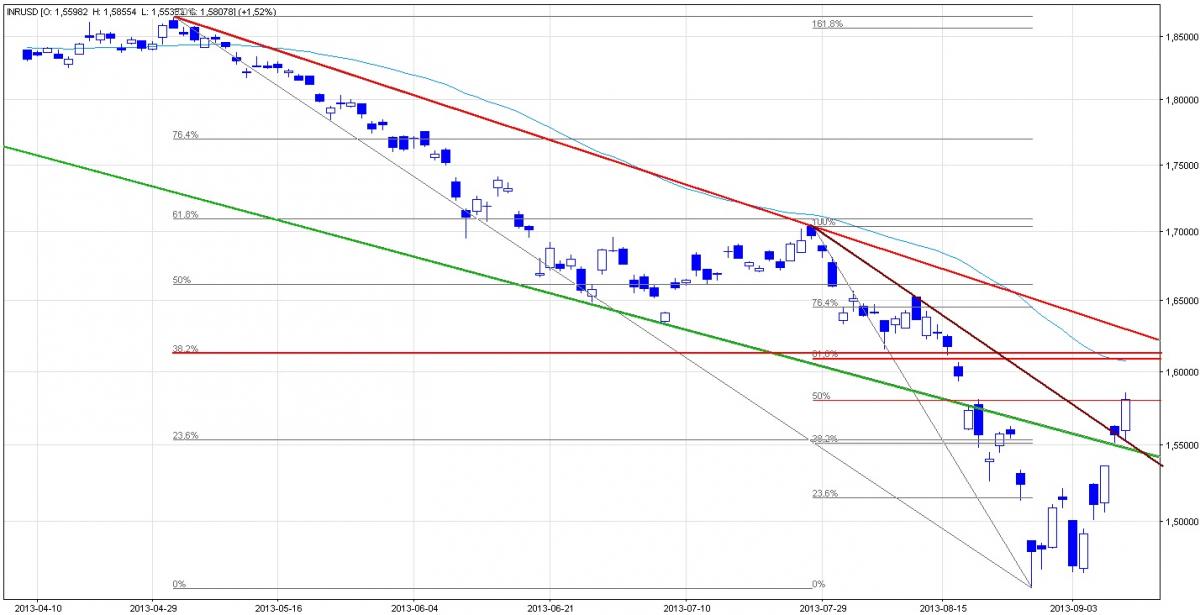
On the above chart we clearly see that the situation has improved in the recent days. The INR/USD exchange rate broke above the strong resistance zone based on the previously-broken green long-term declining support/resistance line, the 38.2% Fibonacci retracement level based on the entire July-August decline and the declining resistance line based on the July and August 12 tops.
These positive circumstances encouraged buyers to act and resulted in higher values. In this way, the Indian rupee reached the 50% Fibonacci retracement level based on the entire July-August decline. Today we saw a small breakout above this resistance level (but only on an intraday basis), which is not yet confirmed.
Taking the above into account, in the following days we may see a corrective move to the previously-broken declining resistance line based on the July and August 12 tops.
On the other hand, if the buyers do not give up, the next price target will be around the 61.8% Fibonacci retracement level. Please note that this area is also supported by the 38.2% Fibonacci retracement level based on the entire May-August decline and the 50-day moving average.
Summing up, the recent strength of the rupee against the dollar resulted in a correction which took gold below the 38.2% Fibonacci retracement level (based on the entire June-August rally) and the 1.618 ratio. If the Indian currency drops to the previously-broken declining resistance line based on the July and August 12 tops we will likely see a pullback in gold in coming days. However, if the Indian rupee goes up once again, we should prepare for lower values in the yellow metal. As noted earlier in this essay, both gold and the rupee moved closer to important support/resistance zones. Taking the above into account and combining this with the fact that the negative correlation between gold and the rupee still remains in place, in the near future we might see significant changes in the direction in which they move.
********
If you'd like to stay up-to-date with our latest free commentaries regarding gold, silver and related markets, please sign up today.
Thank you.
Nadia Simmons
Sunshine Profits‘ Contributing Author
Gold Trading Tools and Analysis - SunshineProfits.com
* * * * *
Disclaimer
All essays, research and information found above represent analyses and opinions of Nadia Simmons and Sunshine Profits' associates only. As such, it may prove wrong and be a subject to change without notice. Opinions and analyses were based on data available to authors of respective essays at the time of writing. Although the information provided above is based on careful research and sources that are believed to be accurate, Nadia Simmons and his associates do not guarantee the accuracy or thoroughness of the data or information reported. The opinions published above are neither an offer nor a recommendation to purchase or sell any securities. Nadia Simmons is not a Registered Securities Advisor. By reading Nadia Simmons’ reports you fully agree that he will not be held responsible or liable for any decisions you make regarding any information provided in these reports. Investing, trading and speculation in any financial markets may involve high risk of loss. Nadia Simmons, Sunshine Profits' employees and affiliates as well as members of their families may have a short or long position in any securities, including those mentioned in any of the reports or essays, and may make additional purchases and/or sales of those securities without notice.


