Gold Price & Silver Price Update


Gold made a new five year low last Friday. It is hanging on the last inch of its support zone between US$1,130 and US$1,140. While my model has correctly been bearish since mid of June I personally thought that the positive seasonality, the extreme negative sentiment and the bullish CoT-Data would deliver more support. Obviously my model has been smarter than myself which was the intention for its creation...
Now the door is wide open for the long expected final capitulation in Gold. With the recent extremely bearish price action it should be clear that Gold will need to see the US$1,035-US$980 before a new bull market can begin. However if prices reverse from here to the upside a tradable bottom and a seasonable bounce is very likely.
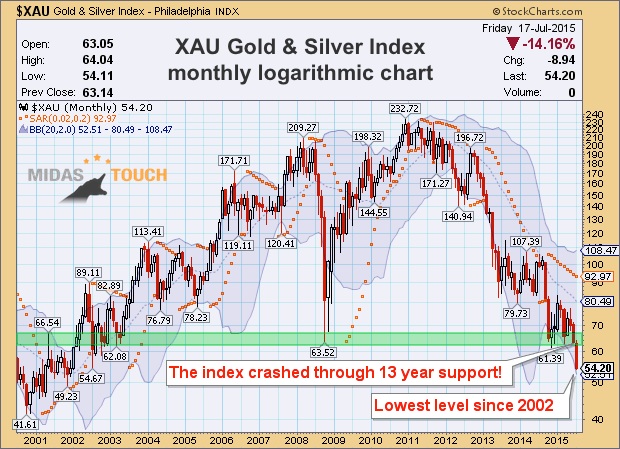
The Philadelphia Gold and Silver Index XAU has been listed since 1979. It currently represents 30 different mining companies. Last Friday this index hit a 13 year low after crashing through longterm support around US$65. The performance of the mining sector is simply a disaster. While Gold still is up 328% from its 2001 lows this index is down 1.68% over the same timeframe.
The Midas Touch Gold Model
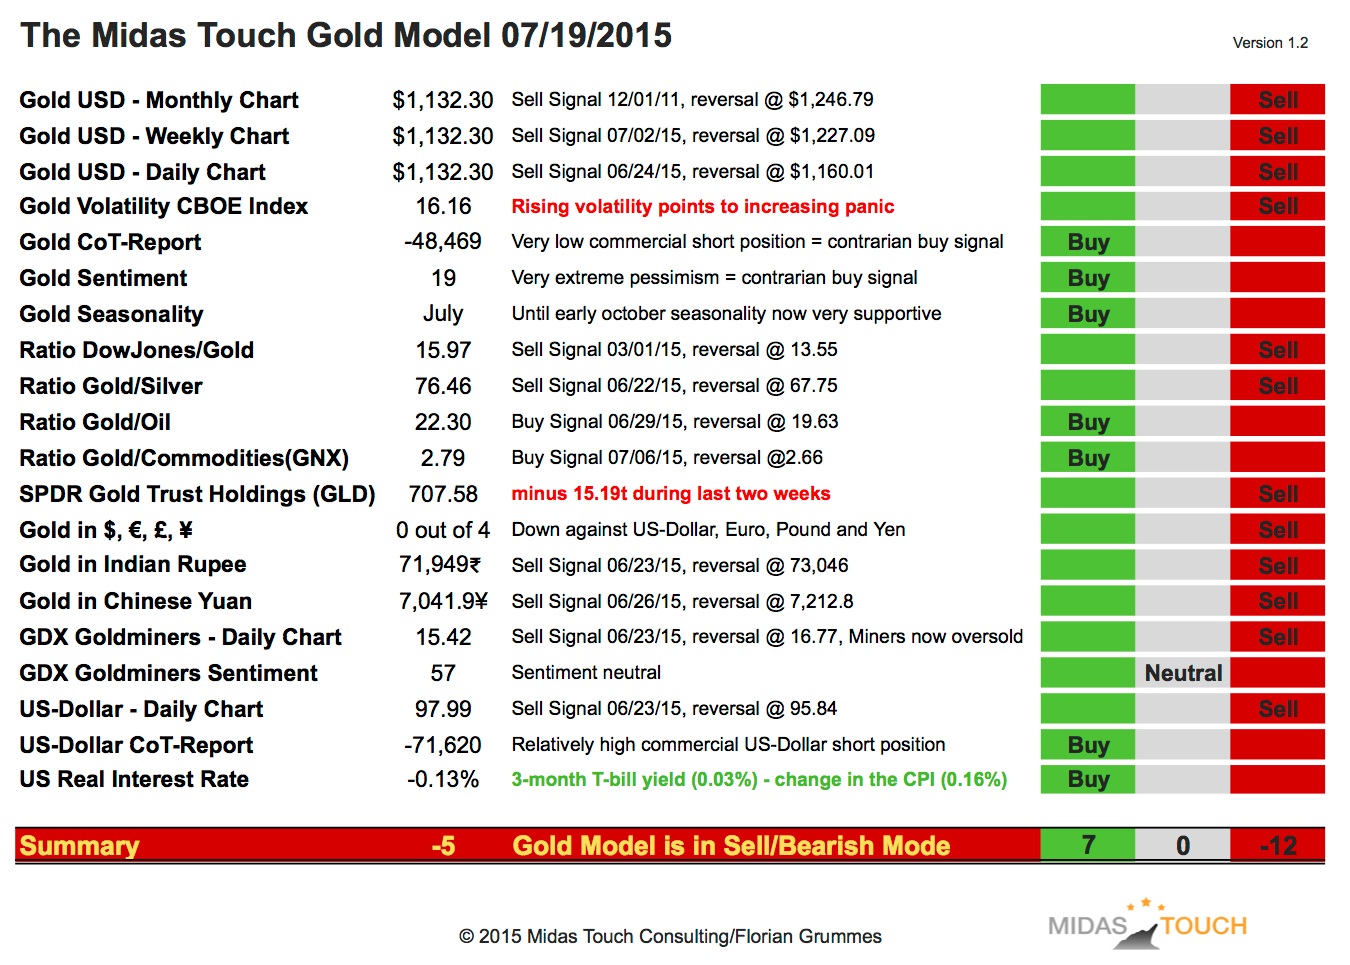
My mechanical model continues to be in Sell/Bear Mode. Due to the rising volatility the Gold Volatility CBOE Index changed to a sell signal. The SPDR Gold Trust lost 15.19 tonnes during the last two weeks and therefore this analysis module switched to a sell signal. The only positive change comes from the US Real Interest Rate. The monthly year-over-year percentage change in the U.S. Consumer Price Index turned positive for the first time in 2015! According to my formula this pushes the US Real Interest Rate into negative territory! A very bullish intermediate factor for Gold....
Overall the model is in Sell/Bear Mode but the Gold CoT-Report as well as the Gold Sentiment and Seasonality continue to support a summer-rally.
Gold Daily Chart
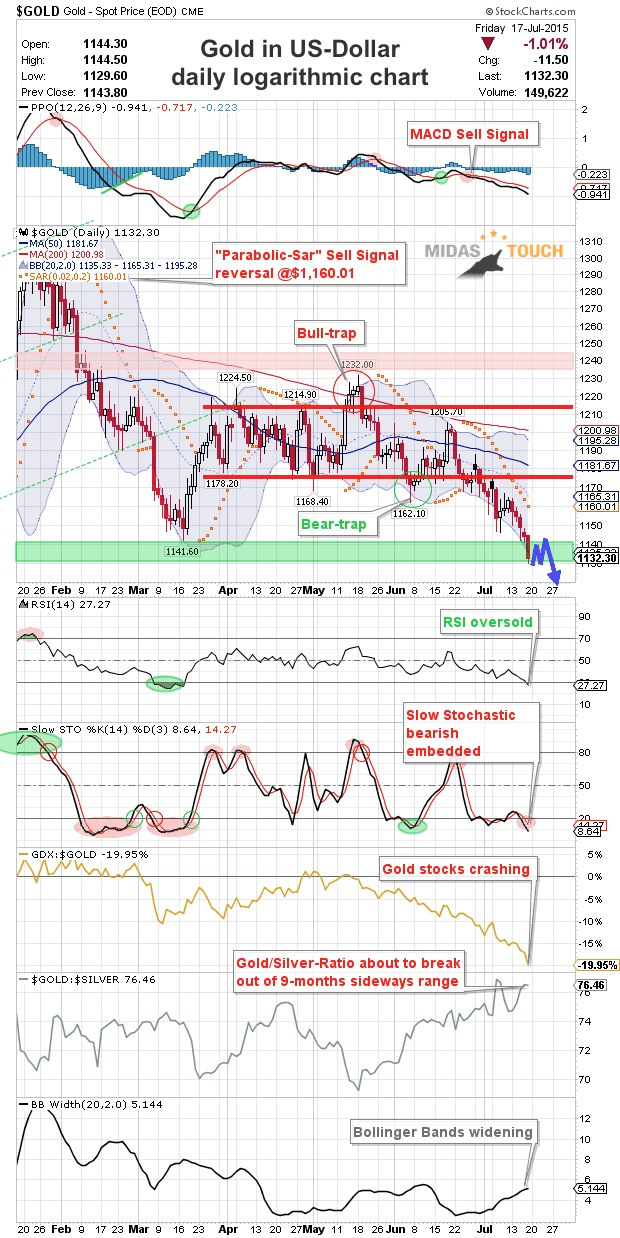
Gold has been sliding down the Bollinger Band since end of June already. Now it looks like it will crash though the November 2014 support at US$1,130. It´s far below its 50MA (US$1,181) and its 200MA (US$1,200). On top the slow stochastic indicator is now bearish embedded with both signal-lines being below 20 for three consecutive days. This typically locks in the downtrend. Any recovery in the next couple of days should therefore be short-lived and probably a dead cat bounce. Only a move above US$1,160 will signal that we have a tradable bottom in place and that the seasonal summer rally is on its way.
Short-term traders should only use a move above US$1,160 as a trigger to go long. Betting on a continuation of the bear trend unfortunately comes with a very bad risk/reward ratio as Gold is getting oversold.
Investors had the chance to accumulate physical Gold below US$1,150 last week. I suggest to lower this limit now down to US$1,100.
Long-term personal beliefs
The return of the precious metals secular bull market is moving step by step closer and should lead to the final parabolic phase (could start in summer 2015 or 2016 and last for 2-5 years or even longer). Before this can start Gold will need a final selloff down to $1,050-$980. My long-term price target for the DowJones/Gold-Ratio remains around 1:1. and 10:1 for the Gold/Silver-Ratio. A possible long-term price target for Gold remains around US$5,000 to US$8,900 per ounce within the next 5-8 years.
Fundamentally, as soon as the current bear market is over, Gold should start the final 3rd phase of this long-term secular bull market. 1st stage saw the miners closing their hedge books, the 2nd stage continuously presented us news about institutions and central banks buying or repatriating gold. The coming 3rd and finally parabolic stage will end in the distribution to small inexperienced new traders & investors who will be subject to blind greed and frenzied panic.
********
If you like to get regular updates on this model and gold you can subscribe to my free newsletter here: http://bit.ly/1EUdt2K
 Florian Grummes (born 1975 in Munich) has been studying and trading the Gold market since 2003. In 2008 he started publishing a bi-weekly extensive gold analysis containing technical chart analysis as well as fundamental and sentiment analysis. Parallel to his trading business he is also a very creative & successful composer, songwriter and music producer. You can reach Florian at: [email protected].


