Gold Signals its Intent


In the ever-turbulent metals markets, nothing is as constant as change, as the saying goes. During the course of the shifting supply/demand balance from the demand side to the supply side of the scale, sellers had their way over the market in July and August. Yet the scale appears to be shifting once again and not a moment too soon. The seasonal and cyclical tendencies of the market are also changing in support of an extended upside run that should be underway in September. In the following paragraphs we'll update our short-term forecast for gold futures and what we can likely expect in the month ahead.
December gold futures closed last week at $308.80, nearly $3 off their lows for the week. Gold also closed at the top of its intra-day trading range on Friday, another positive. But what has impressed us the most about the gold market in recent weeks is its tenacity in keeping above two of its critical benchmark supports, $295-$300 and $305-$306. The former of course is a major chart and psychological benchmark since it represents not only a major rally reversal and breakout point from recent years but also the proverbial "line in the sand" for the past year's upside run.
The $305-$306 area is important as a price support because not only has it served as a pivotal point for gold swings in the past but it also is one of W.D. Gann's "natural support" levels in the Square of 20. In the Square of 20 (which is composed of four equilateral cubes of 20 squares each for a total of 400 squares altogether), the 305-306 area is an intersection point between the two main lines of support/resistance in the lower right-hand cube. This makes it a vitally important numerical support, and this may explain why the $305 area in the December gold chart has been such a strong supporting floor over the past month. In fact, there really hasn't been but one close beneath $305 since April and none at all in August. Also, the intra-day lows have held above $305 since the first day of August, the day of gold's latest short-term cycle low.
This brings us to the next consideration in our analysis of support and resistance in the gold market. Since the mid-July peak at around $328, gold futures have been tracing out a clearly defined symmetrical triangle with the highs near $328 and the lows at the August 1 low of $300.30. The apex of the triangle is at precisely $310 and ends in early September. Not coincidentally, $310 (besides being an immediate overhead chart resistance in December gold) is the "magnetic mid-point" in the gold market between the February lows and the June highs. Thus $310 takes on added significance.
The $310 level is also another important Square of 20 "natural resistance" level. In the Square of 20, the square representing 310 falls along just beneath the central horizontal line in the acrostic that divides the four main cubes. Any number that falls along this boundary is usually a strong chart support/resistance level, and $310 has obviously been on in the gold market. By closing above $310 (by at least 3%) gold futures will signal that a rally has begun and that an important supply area has been absorbed. This will clear the way for the next upside run in gold prices.
Be forewarned, however, that gold must remain above $305 in coming days to stay technically healthy for a potential breakout, and can fall no lower than $300, otherwise its rally potential heading into September will be severely curtailed. Moreover, closing beneath $300 would essentially mean a downside breakout from a triangle consolidation, with measuring implications down to at least $280-$285.
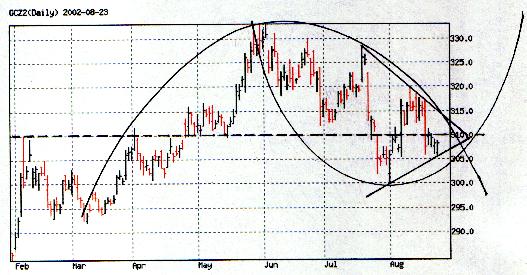
Now comes the interesting part of our analysis of the December gold daily chart. We've noted in recent weeks the conflict between the buyers and sellers in the form of the parabolic dome (representing selling pressure) and parabolic bowl (representing buying power) in the chart. We have labeled this interaction as "dueling forces" in the gold market. Well for the first time in weeks, the parabolic bowl has moved beyond the dome, meaning the buyers now have the advantage. It remains up to them to press their advantage, and this should, if successful, result in the upside penetration of the symmetrical triangle in the daily chart above $310. Note our rendition of this chart below, which shows all the various phenomena we've discussed in this article (triangle, parabolas and magnetic mid-point).
If we have framed the current market picture correctly, the gold market's current battle is between the supply that exists above $310 and the demand between $300-$306. It remains up to the market forces to force the issue and determine the outcome, and to the individual trader to follow the lead of the market. This signal will be given upon the resolution of the triangle pattern currently in formation in the daily chart. At present, we give the advantage to the buyers and believe they will ultimately prevail in forcing a breakout above $310, probably sometime in September.


