Gold Technicals Turn Bullish


JP Morgan just issued a key report, urging institutional investors to buy commodities (and protect those new positions with put options).
They note that crude oil has not confirmed the declines seen in most other commodities, and that’s important.

You are looking at the daily oil chart. The $100 round number HSR (horizontal support and resistance) zone is pretty significant to traders, psychologically.
The JPM analysts suggest that oil could surge above $100 quite soon, based on a number of factors.
I’ll add that a surge in oil prices could increase the current cost of mining gold substantially. Gold has already fallen to what I call the “COP” zone. For most mining companies, the cost of producing gold is in the $1200-$1250 area.
Mining companies like Barrick and Newcrest are already taking action. They have announced layoffs and production delays.
Simply put, less supply with steady demand should be good news for the price of your gold!
Having said that, I’m not a buyer. I’m a light seller now. Gold has arrived at light sell-side HSR, and traders need to book some profits.

That’s the hourly bars chart for gold. I’ve highlighted a nice inverse head and shoulders bottom formation that has come into play.
The target of this bullish pattern is about $1320, which is also significant sell-side HSR.
From the lows near $1180, gold has already rallied about $85. It’s important to book profits when you are in a good mood, rather than selling only because you think gold “might fall below the price I paid for it”.
If gold arrives at minor trend sell-side HSR, sell a “minor” amount of it. Sell more in the $1300-$1320 area, if it gets there.

That’s the daily chart for gold, and it suggests there is a good chance that gold will make it to $1320. A potential short-covering rally could take it even higher.
Note the extremely bullish position of my stokeillator (14,7,7 Stochastics series). The lines are touching, and a crossover buy signal seems imminent.

I believe the negativity amongst most gold investors and hedge funds is so pervasive around the world, that a shocking and violent move to the upside is a realistic possibility.
A large inverse head and shoulders bottom pattern may be forming on this daily gold chart. If it does get completed, the minimum target price would be about $1800.
It’s hard to know how high gold stocks could rally in such a scenario, but I think it would make most investors in the gold community pretty happy.
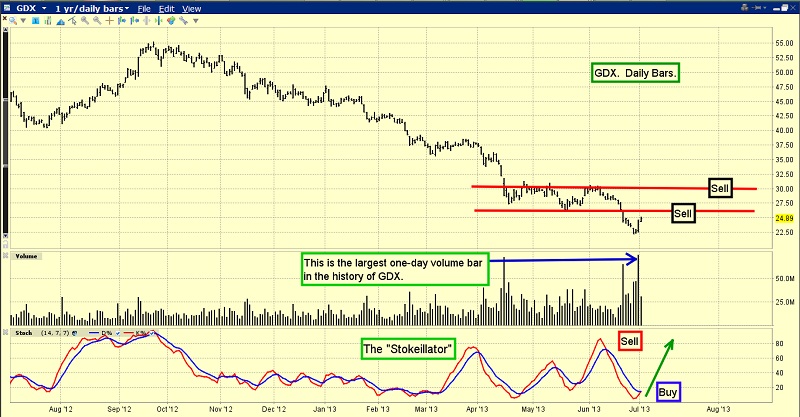
You are looking at the daily GDX chart. Note the “historic” volume bar that I’ve highlighted, which came on an up-day.
Not many technical analysts focus too much of their energy on volume analysis, and I think that’s a serious error.
Volume analysis is arguably more important than price analysis, and the enormous volume bar on this GDX chart needs to be respected. It is extremely bullish.
Also, please note the position of my stokeillator. If you look closely, you can see that the lines have just crossed, creating a significant technical buy signal.
Regardless of the bullish big picture that is appearing, traders should be very light sellers of gold stocks now, because gold bullion is hitting light HSR. Sell a bit more if GDX trades near $26.24 and $30 (round number HSR).
Over the past week, key institutional analysts and brokers at Goldman Sachs and Scotia Mocatta have suggested the decline in the precious metals sector is “near the end, or at the end”, at least for this year.
Now, JP Morgan’s analysts have apparently joined this interesting “golden choir”. You can be quite sure that their institutional clients are not only listening very carefully, but taking action. The numerous gold stock bears that have recently invaded the gold community don’t seem to understand what is happening, and they may be about to get taken to the gold stocks woodshed, by thousands of institutional money managers! I haven’t seen the gold and gold stock charts look this bullish in quite a while. Book light profits on your trading positions if the price goes higher now, while holding solid core positions, for the long term!
 Stewart Thomson is president of Graceland Investment Management (Cayman) Ltd. Stewart was a very good English literature student, which helped him develop a unique way of communicating his investment ideas. He developed the “PGEN”, which is a unique capital allocation program. It is designed to allow investors of any size to mimic the action of the banks. Stewart owns GU Trader, which is a unique gold futures/ETF trading service, which closes out all trades by 5pm each day. High net worth individuals around the world follow Stewart on a daily basis. Website: www.gracelandupdates.com.


