Gold Through Eleven Is Hardly In Heaven


That blur you just saw was November. A month alone in which the trading range for Oil was a dramatic 32%; even both Silver and Copper traced ranges exceeding 7% for the year's eleventh month; the S&P 500, too, had a 7% trading range. Gold's range for November? 3.6%. Of the 21 trading days for the month, Gold was priced in the 1220s during 16 of them. Nary did price move up to 1240, nor below 1196. More nitty-gritty? Of the 499 trading hours in November, Gold traded in the 1220s during 279 of them: that's 56% of the time. Indeed Gold settled nine of the month's last ten trading days in the 1220s, including yesterday (Friday) at 1228. To quote from last week's missive: "...simply guess that the price of Gold is around 1220 and you'll likely be right..." "Whoomp! (There It Is), Whoomp! (There It Is), Whoomp! (There It Is)"
As onerously stagnant as has become the price of Gold, there is one silver (poor pun) lining for us analysts: price's never going anywhere anymore means that we haven't been burdened with the need to adjust the scaling on our charts, in turn bringing less stress upon one's wrist in tandem with less wear to one's mouse and keyboard. So that's a good thing.
But as we turn to the standings of our BEGOS Markets year-to-date, what was the one big winner -- Oil -- has gone full off the boil. Throughout most of this year's months, Oil has dominated the top of our table, trading in the 70s at some point in each of May through October: this past week saw price go sub-50. (All that plunge and yet at our local petrol pump they're still stealin' over $3.60/gallon for the El Cheapo "regular" -- but that's San Francisco). Can it be any worse than Oil? 'Course it can, for as the standings show, we've Silver at the at the barrel's bottom, -16.1% for 2018 through November:

As for Gold's being -5.9% year-to-date, it still finds itself above (+4%) where 'twas at this time in 2016, but below (-4%) where 'twas at this point a year ago. And as we go to Gold's weekly bars, the picture shows time and again these many weeks Gold's price stuck betwixt the base of The Box (1240-1280) and the parabolic Long trend's rising blue dots. In the new week, such trend would end upon price dropping through the rightmost dot at 1204, the alternative being to scamper up into the safety and serenity of The Box only to then spend many-a-month therein:
Not to be overlooked is the glaringly high Gold/Silver ratio there at 86.2x. A valued charter reader of The Gold Update wrote to us in the midst of yesterday's trading session suggesting 'tis been years since the ratio was north of 86x. Our reply: "Yep, live reading is 86.1x: We were also above it a couple weeks ago, but prior to that (on a closing basis) not since 21 Nov 2008, (ten years ago)." The price of Silver settled the week at 14.250; the millennium-to-date average of the ratio is 63.8x; were Sister Silver in tune with that ratio today she'd be at 19.245 (i.e. 35% higher ... and that's just to play catch up).
"And priced where per the lowest ratio since 2001, mmb?"
Ah Squire, back from your Thanksgiving peregrinating. Good question: the ratio's lowest reading (on a closing basis) was on 28 April 2011 at 31.7x for a price equivalency today of 38.730 (i.e. 171% higher).
"Now that's my kinda overshoot, mmb!"
You'll likely live to see that and so much more, Squire. (The lad is ageless, you know).
As for the picture from a full year ago-to-date, Gold has suffered far less than have its fellow equities. Per the below chart we find the yellow metal -4%, the balance of it all becoming progressively worse with Newmont Mining (NEM) -13%, both the VanEck Vectors Gold Miners exchange-traded fund (GDX) and Franco-Nevada (FNV) -15%, the Global X Silver Miners exchange-traded fund (SIL) -26%, and Goldcorp "Good Gracious!" (GG) -27%. For the latter compared to Gold's decline, that implies leverage of better than 600%! Just sayin...
Lacking any and all leverage is the Economic Barometer. Just when one thought it might finally lift, it instead further lapsed, not helped this past week by a decline in November's Consumer Confidence, October slowing in both Core Personal Consumption Expenditures (a Fed-favoured measure) and New Home Sales, as well as a ripe El Plungo in Pending Home Sales. To be sure, increases in November's Chicago Purchasing Managers Index and in October's Personal Income and Spending served to lessen the drop, but down is down -- so much so that we think Federal Reserve Bank Chairman Powell may actually have peeked at the Econ Baro prior to his Wednesday address at the Economic Club of New York wherein 'tis said a dove flew from his hat. Good on ya, Jay. As for the stock market? No worries (our "live" price/earnings ratio for the S&P 500 at an ever so lofty 40.4x): we'll keep the medicine chest open for ya:
Meanwhile over at Morgan Stanley, equity strategist Mike Wilson in commenting on "the rolling bear" sees the selling of stocks as only half done, which going into next year would directionally align with our seeking S&P 2154. Even the Fed itself in a report issued this past Wednesday on private sector debt and the banking system pointed to "...generally elevated [asset prices ... which combined with] An escalation in trade tensions, geopolitical uncertainty, or other adverse shocks could lead to a decline in investor appetite for risks in general ... The resulting drop in asset prices might be particularly large, given that valuations appear elevated relative to historical levels." Recall our p/e for the S&P? Got Gold? Got Silver?
Then back across the pond, derivatives darling Deutsche Bank is under a polizei raid with respect to running money through the wash, whilst ongoing Brexit uncertainty has made "uninvestible" the UK's equity market. And looming through it all is the not so TV-FinMedia-favoured S&P 500 "death cross" because "everybody changes the channel!" Moreover, oh-no say it ain't so, according to a Bloomy opinion piece, "The bitcoin crash is a real currency crisis." Really? A real currency crisis would be of one widely accepted (i.e. not the Venezuela Bolívar) in turn rocketing Gold well higher. Hasn't happened, yet...
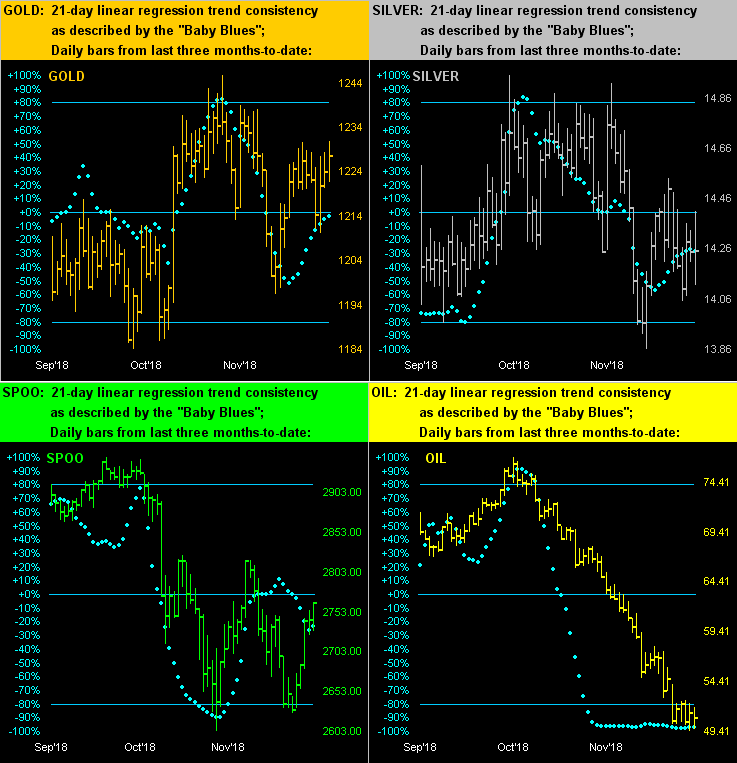
Let's go to our graphic of the precious metals' daily bars for the past three months along with their "Baby Blues" which depict linear regression trend consistency. Also included -- given their drama -- therein are panels for the S&P 500 ("Spoo") and Oil. Respectively at top-left and top-right, Gold and Silver continue to merely meander, their Baby Blues in both cases indicative of their 21-day trends being flat to down. At bottom-left, the S&P's Baby Blues managed to get back to their 0% axis before keeling over again, suggestive of still lower levels. And then at bottom-right there's Oil: without combing back through 2001 and beyond, doubtless we've never seen such Baby Blues flat-lining for Oil, let alone for any of the other BEGOS Markets. But upon Oil's blue dots crossing above their -80% axis, the then already rising price ought have further to run. Something for which to watch:
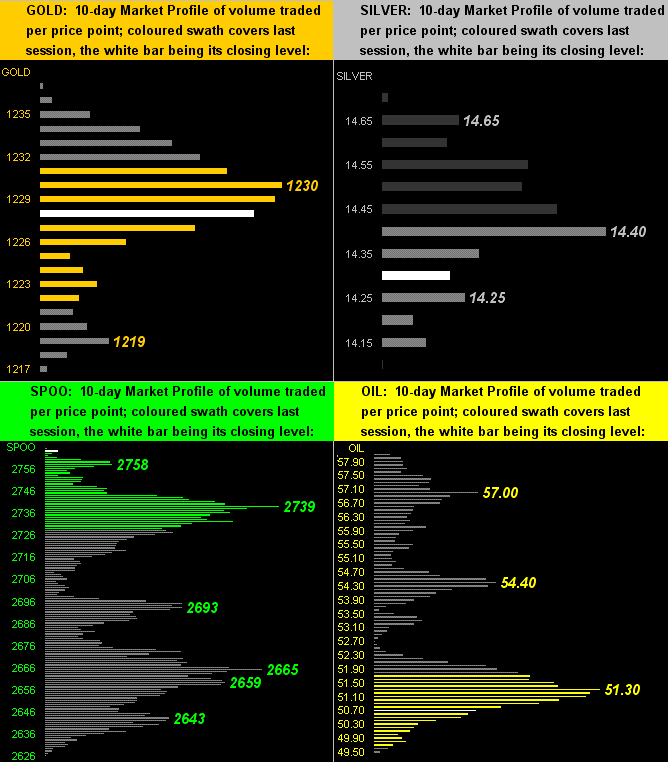
For their respective 10-day Market Profiles we also show these same four BEGOS components as follows, denoted with their trading prices of highest volume. Again: narrow ranges are the order of the day for Gold and Silver (upper half), whilst vast are the ranges for the S&P and Oil (lower half):
In closing, month's end wouldn't so be without our Gold Structure chart of price's monthly bars from 2011's All-Time High-to-date. Here they are with so much overhead strata, seemingly eternally, waiting to be recovered:

So there all 'tis. Eleven months gone in 2018, with Gold indeed hardly in heaven. And speaking of the yellow metal, do you know -- according to the numbering employed by the International Union of Pure and Applied Chemistry -- that Group Eleven ("11") in their Periodic Table of the Elements consists of Gold, Silver and Copper? A fourth element they've thrown in to round out that valued bunch is something called Roentgenium of which neither have we heard nor can pronounce. So keep it simple with just one syllable: keep with Gold!
(Yikes!) Cheers!

Mark Mead Baillie has had an extensive business career beginning in banking and financial services for two years with Banque Nationale de Paris to corporate research for three years at Barclays Bank and then for six years as an analyst and corporate lender with Société Générale.
For the last 22 years he has expanded his financial expertise by creating his own financial services company, de Meadville International, which comprehensively follows his BEGOS complex of markets (Bond/Euro/Gold/Oil/S&P) and the trading of the futures therein. He is recognized within the financial community of demonstrating creative technical skills that surpass industry standards toward making highly informed market assessments and his work is featured in Merrill Lynch Wealth Management client presentations. He has adapted such skills into becoming the popular author each week of the prolific “The Gold Update” and is known in the financial website community as “mmb” and “deMeadville”.
Mr. Baillie holds a BS in Business from the University of Southern California and an MBA in Finance from Golden Gate University.


