The Golden Days Are Here


Our analysis estimates how high will the current gold and silver bull markets (2000 to 2020) reach from a technical cycle perspective. We will not go over the detail of our cycle analysis based on Fourier transformation as they have been treated in several articles published on this website. We firmly believe that the precious metal prices will rise explosively from the current correction level till 2020. They will far outperform the DOW and related equity markets.
Generational Bull And Bear Markets
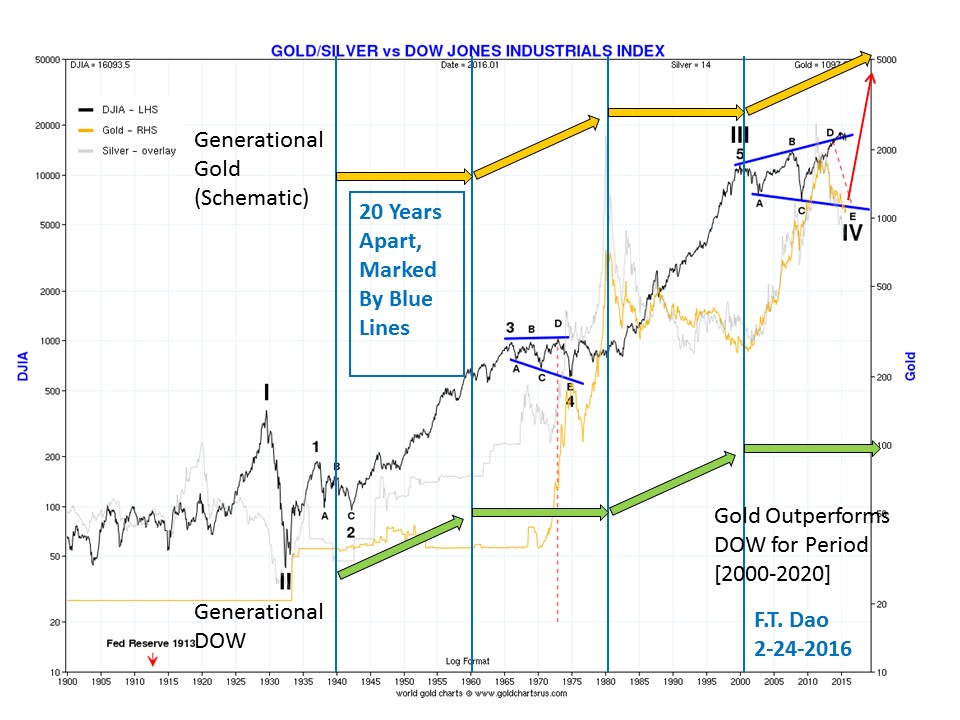
First , we noted an interesting phenomenon from the above chart, namely for every generation (20years), gold and silver as hard assets alternate with the paper assets represented by DOW in the rhythm of rise and fall in price. The current gold and silver market began in 2000. Currently they have just completed the correction and are starting to rise again. Meanwhile, Dow has been oscillating since 2000 and it is now in the process of dropping down for the 3rd time.
Review of Gold, Silver and Gold Stocks
As discussed in our earlier articles on gold and gold stocks, we indicated that the nature of current gold bull market (2000 to 2020) is very similar to the 1980 bull market in cycle structure. Note the cycle profiles are generated internally from the long series of price data based on Fourier transformation. Below is a chart showing the gold stock index (HUI) with similar cycle patterns.
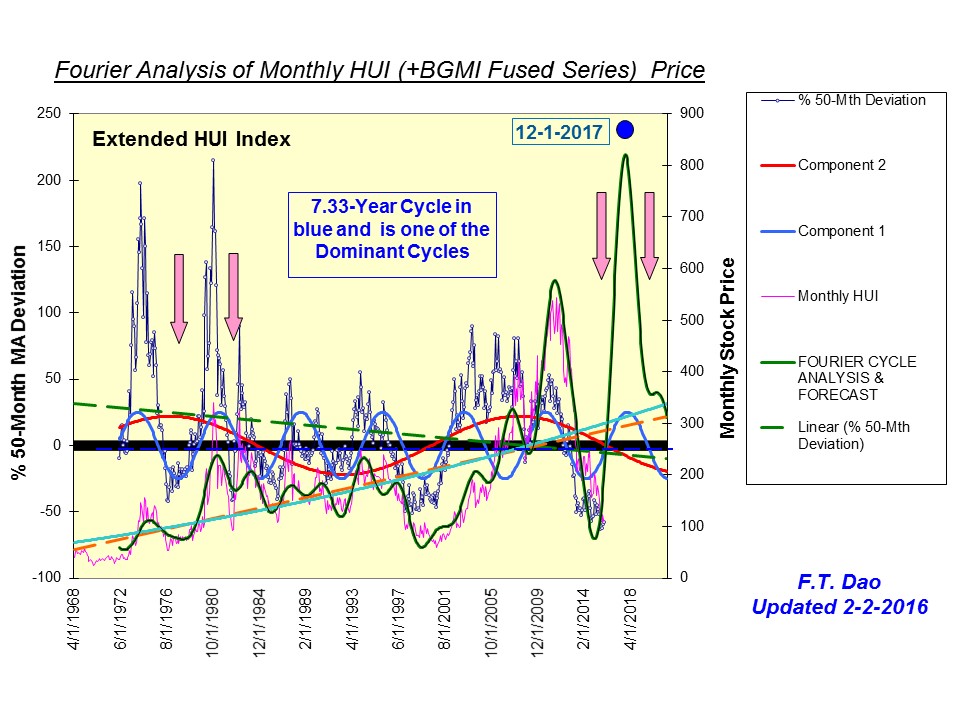
These similar peaks are marked by labels A, B and C. The silver price behaves similarly and the comparison between gold and silver will be discussed in a separate article.
To estimate the next peak and value for gold and silver in this article, we used simple fractal price comparison. The peak value determined from Fourier based analysis is often underestimated as compared to this simpler method.
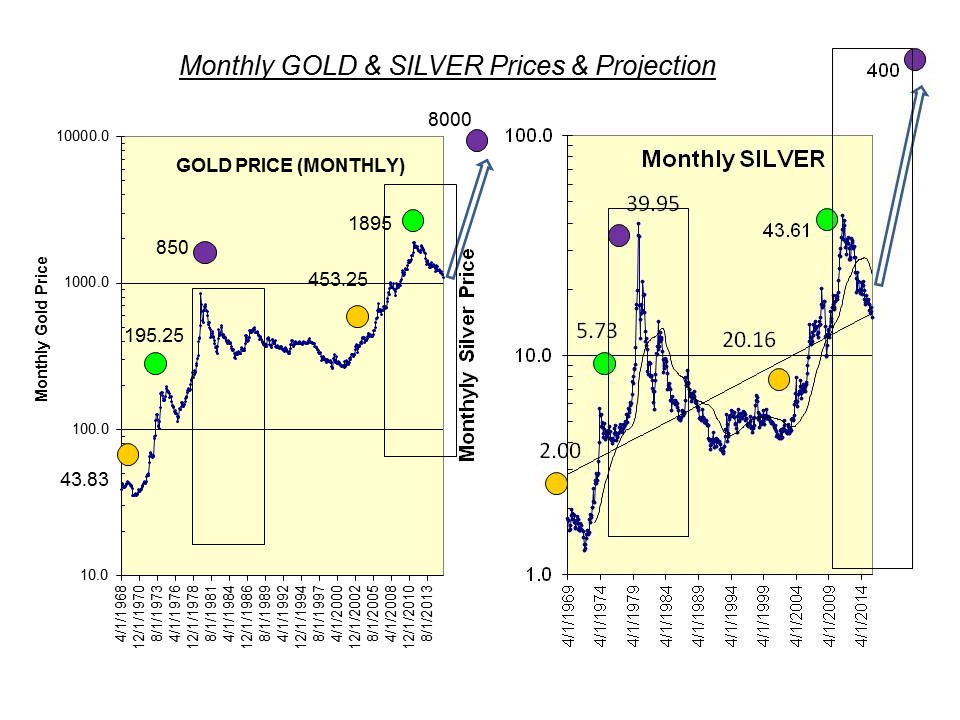
Gold And Silver Peak Values In 2020
The following chart shows the target gold and silver values in 2020. We used a factor of 10 to project the third peaks in 2020. The peak values are comparable to the values from cycle analysis and this will be discussed in our article on a simple investment rule.
Relative Performance of Gold. DOW Index, Silver And Gold Stocks
With the above estimated gold and silver prices in 2020, we compare the investment returns of gold and silver with that of DOW for the 20-year period (2000 to 2020). We start all 4 asset classes with an initial investment of $100 and estimate the returns for the following periods: (1) period from 2000 to 2015, (2) period from 2000 to 2016 and (3) period from 2000 to 2020. We compute the total gains and losses, and the compound growth rate per year.
The results are interesting and unexpected. They are given in the following chart and table:
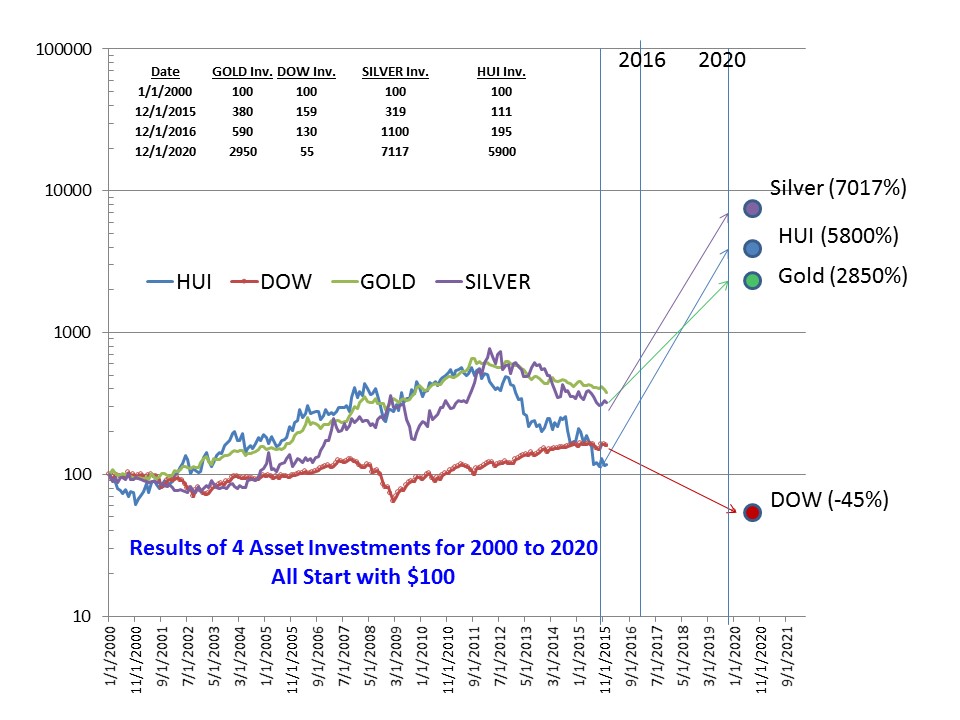
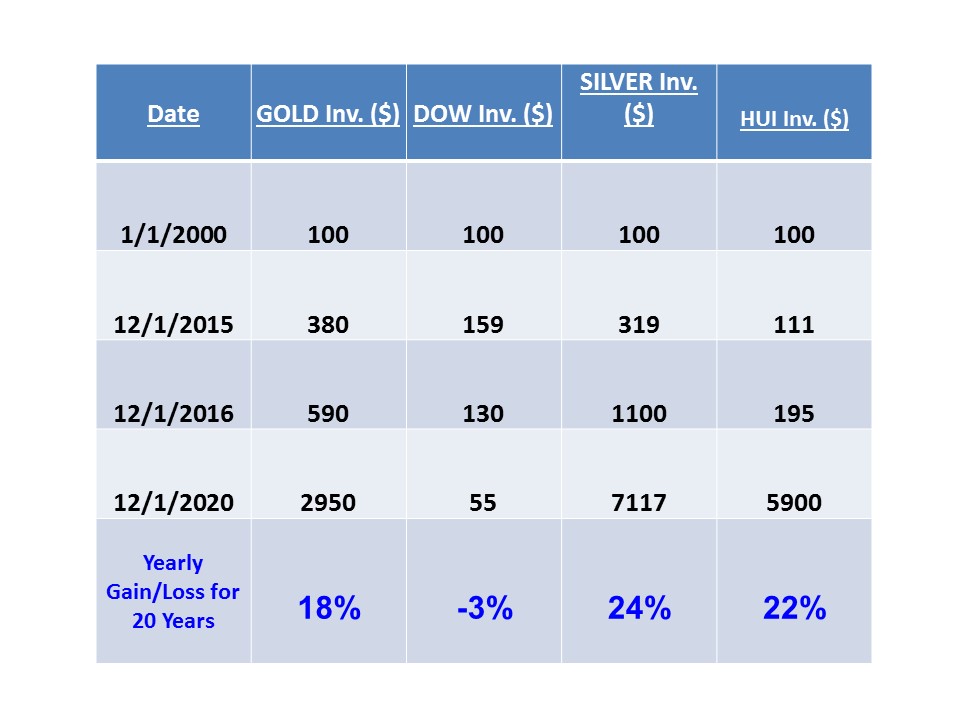
Note the DOW Index is projected to have an overall negative compound growth rate of -3% per year for the 20-year period from 2000 to 2020. The three other assets, namely gold, silver and gold stocks, all have a positive growth rate close to 20% per year. Given the past 4 years of price correction for gold and silver, we expect a big jump in price gain by 2020, including the investment returns for the remainder of 2016. Indeed since 2000, gold and silver have outperformed DOW, even though the gold stock (extended HUI) is only slightly under performed than DOW. From now on, we believe the mining stock will be the best performer till 2020.
Implication for Asset Allocation
The identification of proper asset allocation to gain the maximum investment returns is clearly from our analysis. Suffice to say, gold and silver ought to be a dominant asset class for astute investors right now. This asset is often neglected by fund managers. There are a few exceptions. For example the well known fund manager Stan Druckenmiller has invested 30% of his fund in gold funds, as opposed to 1-5% by other fund managers. As time goes on, there will be a rush into this asset class.
Conclusion
We are private investors and base our investment decision primarily on technical analysis, particularly on Fourier cycle analysis. We prefer to start with a long data series to figure out its dominant internal cycles and explore the historical similarity in patterns. In other words, we adopt a top down approach. Over a long period e.g. 20 years, the investor behavior is the same, regardless of the fundamental cause e.g. inflation or deflation, war or peace. The external stimulants will affect the peak and bottom values in price. Nevertheless we believe the human nature of greed and fear is truly manifested in the long series of price movement. The analytical process can be extended or drilled down from the monthly data used here to weekly, daily price and possibly hourly data series. The cycle analysis can greatly augment the traditional approach to sector rotation and selection in general investment strategies.
One note of caution: We are not fund managers. Perform your own analysis and consult your financial advisors for your investment.
More from Gold-Eagle


