Gold's 2018…It's Now or Never


If Elvis truly has left the building, can someone please go out and get him? For if he can croon his tune that "It's now or never ... Tomorrow will be too late"for Gold to recover in two-oh-one-eight, buyers might be inspired. Indeed at present, our forecast high for Gold's price this year to reach 1434 remains fixed; but in as soon as week's time, that may get nixed.
Regular readers know our sense is should Gold close out a trading week below The Box (1280-1240) that there shall then be too many overhead barriers of price resistance to overcome toward reaching 1434 this year: The Box, The Whiny 1290s, and The 1360s Double-Top, the latter in the last two years repelling price from returning all the way up to the launch point of Base Camp 1377, (our precisely realized forecast high for 2016).
But like Chicago Cubs fans said for better than a century: "There's Always Next Year" and vindicated they eventually were, curiously too in 2016; (perhaps we thus ought all become Cubs fans). As a dear friend of The Gold Update oft quips: "Gold will make you old"; but bollocking along as Methuselah for 900 years awaiting Gold's next Big Move ain't exactly our idea of partying out there ... especially given today's warped undervaluation of price. For as the opening Gold Scoreboard nauseatingly displays, price settled out the week yesterday (Friday) at 1242, a whopping 1576 points (-56%) below our merely prudent valuation (supply increase offset by Dollar debasement) of 2818. Have we ever written "'Tis diabolical"? Too many times.
Too many red dots, as well, as we turn to their still accelerating downside cascade in the weekly bars graphic? This stint is the 16th parabolic Short trend since Gold's All-Time High of 1923 (06 September 2011) and now numbers 11 weeks in length. The median duration of the prior 15 Short trends is 12 weeks and given the arithmetic that pinpoints each dot, price must already be rising before the trend flips to ascending blue dots. Thus within that technical vacuum, one can argue Gold's having fallen to the bottom of The Box combined with the duration of the current parabolic Short trend means higher days lie ahead. "Lie"? Bad word choice there...

In fact, further belying it all is the recent directional breakup of Gold and the S&P 500. You may recall that since 01 June, these two markets were moving in positive correlation, (which for you WestPalmBeachers down there means they'd go up and down together). But come our StateSide Fourth of July, the S&P found fireworks support whilst Gold fizzled. Here are their respective percentage trading tracks from one month ago (21 trading days)-to-date, (the white line being 04 July):
Speaking of stocks, the S&P 500 -- now at 2801 -- is just 72 points (-2.5%) below its all-time high of 2873 (26 January). What happened to our 25% correction targeting 2154? 'Tis still awaitin' in the wings, for whilst Gold is warped to the downside, similarly is the S&P hyped to the upside. As Kevin Muir (East West Investment Management) penned this past week, the bearish trade for the stock market is "so obvious, it can’t be right." Course, everything is great because we're told everything is great, (as long as one avoids both honestly calculating the S&P's price/earnings ratio and tracking the Economic Barometer).
In fact, the latter might serve the FedHeads well, our also reading this past week that they (per the once venerable Reuters) "are scouring new niches of the financial markets to find signals accurate enough to warn the central bank when it is time to stop hiking interest rates before they risk tipping the economy into a recession." To wit, the week's incoming metrics for the Econ Baro included a slowing in the Producer Price Index from May's +0.5% pace to that of +0.3% for June, the Consumer Price Index slowing too from +0.2% to +0.1%; at their respective core levels Export Prices for May slowed their pace, whilst Import Prices actually fell; May's Wholesale Inventories levels ballooned more than moved; and the University of Michigan's vaunted survey of sentiment slipped in its initial July polling. Thus on balance, the Baro tripped:
Continuing their "trip" as well are the precious metals. Here next we've their daily bars from three months ago-to-date for Gold on the left and Silver on the right. In both cases, the good news is the "Baby Blues", the dots rising from the respective -80% axes citing the downtrends' consistency beginning to be less so, primarily from the buying upon Gold's having first reached the bottom of The Box at 1240 in the prior week. Nevertheless, the bad news is both markets yesterday posted lows for the year:

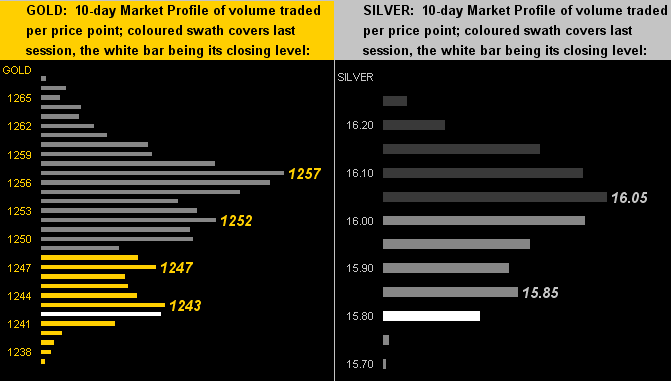
Also "Deep in the Motherlode"--(Genesis, '78) we find the precious metals' prices vis-à-vis their 10-Day Market Profiles, the respective overhead resistors as labeled:
So in turning to the Gold Stack, 'tis a bit of a sorry whack:
The Gold Stack
Gold's Value per Dollar Debasement, (from our opening "Scoreboard"): 2818
Gold’s All-Time High: 1923 (06 September 2011)
The Gateway to 2000: 1900+
Gold’s All-Time Closing High: 1900 (22 August 2011)
The Final Frontier: 1800-1900
The Northern Front: 1750-1800
On Maneuvers: 1579-1750
The Floor: 1466-1579
Le Sous-sol: Sub-1466
Base Camp: 1377
2018's High: 1369 (11 April)
The Weekly Parabolic Price to flip Long: 1301
The 300-Day Moving Average: 1292 and rising (barely)
Neverland: The Whiny 1290s
The Box: 1280-1240
10-Session “volume-weighted” average price magnet: 1252
Trading Resistance: 1243 / 1247 / 1252 / 1257
Gold Currently: 1242, (expected daily trading range ["EDTR"]: 11 points)
Trading Support: none (per the 10-day Market Profile)
10-Session directional range: down to 1236 (from 1267) = -31 points or -2.4%
2018's Low: 1236 (13 July)
In closing, 'tis all things France this weekend, today (Saturday) being Bastille Day with tomorrow's World Cup final in the balance. The first time France won the World Cup was on 12 July 1998: in the ensuing week, the price of Gold rose from 291 to an intra-week high of 296, an increase of 1.7%. Should such history repeat itself, we'd see Gold recover this week to as high as 1263. Now or never, indeed. Alors, je te dis:
Vive La République!
Allez Les Bleus!!
Accroches-toi ton Or!!!
![]()

Mark Mead Baillie has had an extensive business career beginning in banking and financial services for two years with Banque Nationale de Paris to corporate research for three years at Barclays Bank and then for six years as an analyst and corporate lender with Société Générale.
For the last 22 years he has expanded his financial expertise by creating his own financial services company, de Meadville International, which comprehensively follows his BEGOS complex of markets (Bond/Euro/Gold/Oil/S&P) and the trading of the futures therein. He is recognized within the financial community of demonstrating creative technical skills that surpass industry standards toward making highly informed market assessments and his work is featured in Merrill Lynch Wealth Management client presentations. He has adapted such skills into becoming the popular author each week of the prolific “The Gold Update” and is known in the financial website community as “mmb” and “deMeadville”.
Mr. Baillie holds a BS in Business from the University of Southern California and an MBA in Finance from Golden Gate University.


