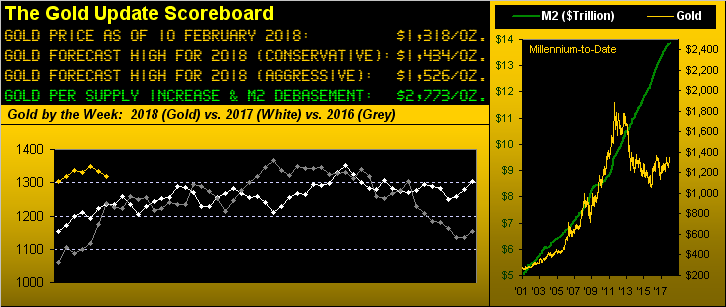
Gold's Mild Descent; S&P500 Index To Drop 25%


Such a fun month is February! One strives to regain liquidity following December's holidays and January's quarterly tax payments. And who doesn't love Valentine's Day?
Financially, February is not a month over which there is much fuss. For gold, February is generally quite neutral: of the 43 Februarys from 1975 through 2017, gold has finished up 22 times and down 21 times for a median net gain of 0.1%/February.
What about for the stock market? For the 48 Februarys from 1970 through 2017, the S&P 500 has finished up 28 times and down 20 times for a median gain of 0.9%/February. But, uh-oh, what just happened?
There's no love for the S&P this February. 'Tis -7.2% thus far this month, and -8.8% from our proclaiming two weeks ago the S&P's "Blow-Off Top". And it gets worse, for there are two other Februarys with which the S&P may now be keeping company that are more daunting. This February may be far from over, but from our purview, neither is the selling. Only two other Februarys negatively rival this one: that of 2001 in the midst of the "Dot Com Crash", the S&P finishing February -9.2%; and in 2009 during the final fallout of the "Black Swan Smash", the S&P closing out that February -11.0%. And what do we remember about the full top-to-bottom culmination of those two events? Both resulted in "corrections" of worse than -50%.
So: do we see this correction as becoming that bad? To be sure, per our 30-year chart of the S&P presented in last week's missive, there is no material structural support for the S&P (presently 2620) until it reaches the 2200-2000 zone. And call it what you will: "The Interest Rate Scare Affair", or as been our pending preference now for years, the squirming over "Look Ma! No Earnings!", the S&P appears destined to put it a full 25% correction as we depicted a week ago down to 2154. Whether that occurs in full this month, or "conveniently" right up to November's mid-term elections, that's our S&P downside target.
But before the baby gets thrown out with the bath water and "they" try to gun it still farther down for a 50% correction "just because", let's do some math:
At the S&P's top two weeks back (2872), the median non-cap-weighted price/earnings ratio for the S&P 500 (conservatively ascribing those companies without earnings their stock price as their P/E) was 26.5x using "ttm" (trailing 12-months earnings). By reducing each stock's price on that date by 25% (i.e. for a 25% correction) and by re-jiggering each stock's earnings to reflect the new corporate tax rate of 21% (vs. the prior 35%), the effect of lower prices and higher earnings brings that version of the P/E down to a lovely, respectable, credible 16.4x. Amazing, eh? Harmonious valuation elation. (Now if we can just get gold back in equilibrium with currency debasement such as to put its price up there at 2773, we'd have the whole package).
For the present, gold yet again finds itself withdrawing from having been near the overhead barrier at Base Camp 1377. Remember when you'd take two magnets and try to impossibly push them together? That's what it has been like for gold trying to reach, let alone cross above, 1377. 'Course as we saw in concert with the S&P hitting its all-time high back on 26 January, the Dollar Index came down to sit upon significant support in its 89.000 area, such that the Buck has since bounced back up at least a wee bit (presently 'tis 90.225). At the same time, to the extent that the Dollar's pop has bopped gold back down from the year's high of 1365 to settle yesterday (Friday) at 1318 is not overly concerning. For as we turn to gold's weekly bars, we see price sitting smack on its ascending dashed linear regression trendline, as the blue dots of the parabolic Long trend also ascend. Even should gold slip for another week or two, staying above 1300 is preferable to having again deal with The Whiny 1290s, (or worse, with the purple bounds of The Box):

More broadly, the critical shelf of support is clearly seen below across Gold's daily settles-to-date from its All-Time High Closing High of 1900 back on 22 August 2011. For now within the purple bands of The Box we find also the 300-day moving average and (also as drawn from the above graphic) the price at which the weekly parabolic trend would flip from Long to Short. Still, the most poignant line of the bunch again is the green one at Base Camp 1377: "One of these days, Alice...":
'Course the big concern these days is over the "I"-word: inflation, the demand for more Dollars to pay for the same amount of stuff thus nicking up interest rates. That in turn is supposedly bad for gold, yet you regular readers well know that whilst the Fed Funds rate during 2004-2006 increased from 1% to 5%, the price of gold rose by better than 50%. But was that also negative for the stock market? Hardly: the S&P during that stretch rose from the 1100s into the 1400s as earnings actually improved, the P/E hovering about in the high teens. The difference today is thus the "E"-word, again as noted within the recent years of the "Look Ma! No Earnings!" environment.
Still, the Economic Barometer has been fairly stout as we next see. But does a diving S&P now put a rate rise in doubt? There are 27 trading days until the 21 March release of the Federal Open Market Committee's next policy statement. Will Powell & Co. commence his chairmanship with a "Pow! Right to the kisser!" of the S&P? Albeit a non-FOMC voter, Dallas FedPres Bob Kaplan hedged this past week in Frankfurt by noting that three rate hikes in 2018 still appear the case, yet that growth may peak this year and then slow for the next two. So why raise if peaking? Dicey days ahead, my friends. Here's the Econ Baro with our alpinesque view of the S&P:
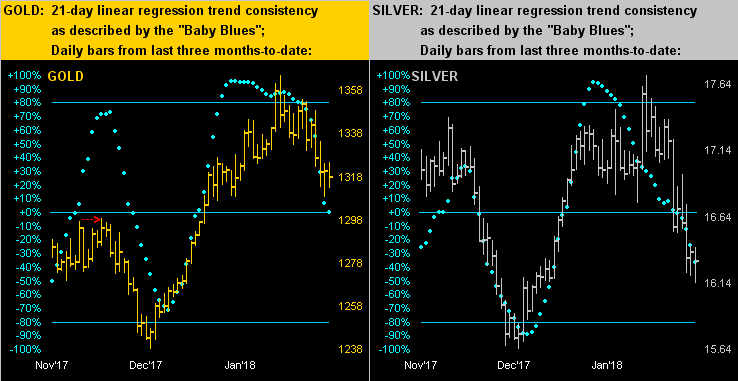
On to the precious metals' daily trading tracks from three months ago-to-date. And therein below left for gold we see its baby blues of 21-day linear regression trend consistency right on the 0% axis; note as well the red arrow at the topping area from late last November: that's 1299 and ripe for a support test, barring Gold reversing back up straightaway. As for Silver below right, her 21-day trend obviously is down, the "Baby Blues" already having breached their 0% axis:
Next we've the 10-day Market Profiles. And if you peek at the website's Market Ranges pages, (the chart therein for the S&P having exploded right up through the roof), you'll see that for both gold and Silver their "expected daily trading ranges" are at levels not seen in at least a year, respectively at 17 points per day for gold and 38¢ per day for Silver. Thus their Profiles tend to contain more price points than we've seen in prior months. Gold's Profile (left) did expand before that of Silver's (right); either way, the overhead trading resistors now stand stark for both metals:

The week ahead brings 19 metrics of economic data into the Econ Baro, but the story shall remain the stock market. This past week brought us more far more communications with folks about stocks than gold, so we close with these few musings:
■ What's happening now right now in the stock market ought have occurred at least three years ago. Cases since have been made by the "10% Correction Crowd" month-after-month, yet the S&P has only gone straight up ... until its "Blow-Off-Top" two weeks back. Thus to make up for the many missed 10% corrections, one of 25% clearly is in order, primarily given the earnings vacuum.
■ What's been lurking about throughout these past three years has now made itself as rife as ever: call it that which you will -- the complacency, the ignorance, the greed, the naïveté, -- the fallout of it all is now on full display in the S&P's mêlée. We can't enumerate the number of times we've queried at our Sunday Investors Roundtables "Do you have stops under the market?" "Might you take a short position in the S&P futures?" "Have you thought about selling calls?" No, no, and no: nuthin' but No. And now suddenly 'tis nothin' but "Uh-Oh!"
■ What's been your favourite market description of the past week? Some that caught our attention include: "global selloff rages", "stocks slammed again", "renewed plunge", "global stock smackdown", "savaged global stocks". A close friend of ours sent us a morose note a full week back about the stock market's "bloodbath" on Friday 02 February: we replied that 'twas but a "paper cut". Another friend sent to us a photo of a grizzly bear; we responded with one of a wee cub.
Our anticipation is for gold to firm these next few weeks or so; but for the S&P, 'tis "Look out below!". Yes we sense the "10% Correction Crowd" shall attempt to save all it, but at the end of the day, we see the year's high for the S&P as now in place with a 25% correction for which to brace. So hang onto your gold!

Mark Mead Baillie has had an extensive business career beginning in banking and financial services for two years with Banque Nationale de Paris to corporate research for three years at Barclays Bank and then for six years as an analyst and corporate lender with Société Générale.
For the last 22 years he has expanded his financial expertise by creating his own financial services company, de Meadville International, which comprehensively follows his BEGOS complex of markets (Bond/Euro/Gold/Oil/S&P) and the trading of the futures therein. He is recognized within the financial community of demonstrating creative technical skills that surpass industry standards toward making highly informed market assessments and his work is featured in Merrill Lynch Wealth Management client presentations. He has adapted such skills into becoming the popular author each week of the prolific “The Gold Update” and is known in the financial website community as “mmb” and “deMeadville”.
Mr. Baillie holds a BS in Business from the University of Southern California and an MBA in Finance from Golden Gate University.


