Large Speculators Returning To Gold…But


 Here is the latest chart detailing the relationship between the Hedge funds NET POSITIONING in the Comex gold market and the price of the actual metal.
I have presented this chart for some time now over at my former website to rebut the silliness from the gold perma-bull camp that any moves lower in the price of gold are ALWAYS the result of “evil bullion banks working to suppress the price of the metal to discredit it”. That mindset had a place at one time – back when the US Dollar was sinking – but is now passé and an extreme waste of precious mental effort and time. The camp that has this as a central tenet of their “faith” has long ago lost any credibility on this issue among serious-minded investors/traders.
Gold has been sinking in price because speculators were simply not interested in it when better returns on precious capital could be obtained elsewhere (in equities in particular). An ultra-low interest rate environment here in the US, with no signs whatsoever of any inflationary pressure, in which global commodity prices were sinking lower while the US Dollar was moving higher was simply one in which it did not favor any serious appreciation in the price of the yellow metal. There was nothing the least bit “conspiratorial” therefore about a falling gold price, an asset which throws of no yield or dividend whatsoever and requires storage fees, insurance, etc. when holding it in any size. In other words, it COSTS to store gold when such money could be better put to work producing actual returns in equities.
Now that there are some concerns about global growth and equities are looking a bit wobbly, gold is getting a bit of a look from some speculators who are cautious at the moment. This can be seen in the return of some hedge funds to the long side of the gold market at the Comex (although I should note that the gold ETF, GLD, continues to display an amazing lack of interest on the part of big Western-based institutional buyers ).
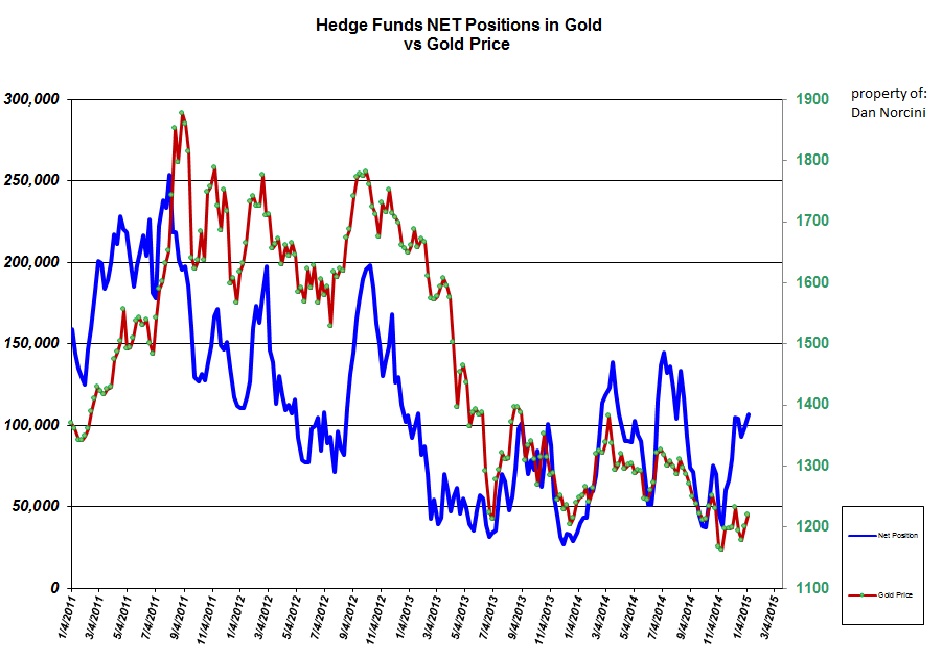
The blue line shows the NET POSITIONING of the hedge fund community. The Red line shows the gold price. As you can see, as the NET LONG Position has increased, so has the gold price. The two track each other EXACTLY.
Something I do want to note however that really stands out for me when I see this chart and analyze it in detail.
Beginning in 2013, while the relationship between the gold price and the net positioning of the hedge fund community remained intact, something happened. Can you see it?
From that point forward, the build in NET LONG positions by the Hedge funds HAS NOT resulted in successively higher gold prices. The opposite is the case. In other words, it is taking more and more buying by Hedge funds to move the price of gold higher but the end result is that the gold price is at lower levels than such levels of net longs would have taken it in the past.
For instance, look at this week’s net long level by the hedge funds. It is currently a bit over 106,000 futures and options combined. A similar level of hedge fund exposure to the gold market back in January 2013 had gold sitting above $1650!
How to explain this ? Simple – While hedge funds have been recently expressing an interest in playing gold from the long side over the Comex, there remains a correspondingly increasing amount of WILLING SELLERS of the metal. To see gold sitting closer to $1200 than it is to $1700 when the net long positions of the hedge fund are at the same level as they were TWO YEARS ago tells me that a very large number of players in gold do not expect high prices in gold to last.
This does not mean gold cannot and will not experience rallies. It is now currently in the midst of one which it taking it up to test resistance between the $1220-$1230 level. It might even be able to take that out and put in a test of $1250. But one does wonder how much buying it is going to take on the part of the hedge funds to really push this market to the point where it actually can do something the least bit exciting; not with this many willing sellers of the metal around.

Here is an intermediate term view of the metal (weekly chart). It has been able to keep aloft above the key $1180 level but thus far has not managed to even make it to the first level of chart resistance noted. Not especially impressive when viewed from this angle is it?
As noted many times when discussing the prospects of this metal – just because a market has found a bottom does not mean it is about to embark on a wildly bullish tear higher. It can meander sideways in a broad trading range for YEARS. Until I see some signs of serious life in this market, I am simply not interested in it other than for short term trading purposes only.
********
Courtesy of http://traderdan.com/


