Market Turning Points


Current position of the market
SPX: Long-term trend – Bull Market
Intermediate trend – Is the 7-yr cycle sketching an intermediate top?
Analysis of the short-term trend is done on a daily basis with the help of hourly charts. It is an important adjunct to the analysis of daily and weekly charts, which discusses the course of longer market trends.
MARKET AT INFLECTION POINT
Market Overview
Last Monday, the bears made another stab at the important SPX support level which had been tested several times before. But the bulls repulsed the attack one more time, driving prices slightly beyond the former high of 2064 on Friday’s better than expected nonfarm payrolls data. However, by then, their drive was spent and they had to retreat. Next week will determine whether the bears have once again regained control and if we can expect one more challenge to the 2080 level; or if the bulls can press their advantage after a pause. For the moment, the retracement may not be much more than cautious profit-taking.
Of the fourteen indices that I follow, only one made a marginal new high: the mid-cap! The performance of the others was mixed, with that of my favorite leading index being the weakest of the group.
Indicators survey
Momentum: Both weekly and daily MACDs have come to an intersection and must decide if they are going to turn right or left.
The weekly SRSI has bounced from its oversold condition, but the daily is now at the top of its range and showing some minor negative divergence.
Breadth: My daily A/D oscillator and A/D SRSI are showing even more pronounced negative divergence.
Structure: Still guessing.
Accumulation/distribution: The short-term pattern has the potential of creating a good sized decline, and the long-term one continues to increase in breadth. At this time it is not yet possible to characterize it as a top formation until the 1972 level has been decisively penetrated.
XIV continues to make lower lows followed by lower highs. Details later.
Cycles: “The 7-year cycle appears to be slowly gaining a foothold”. The 10-wk cycle could have inverted.
Chart Analysis
We start with the weekly SPX (chart courtesy of QCharts, including others below) with the McClellan Summation Index (courtesy of StockCharts.com) posted underneath it.


 The SPX has now concluded its fifth week in a trading range limited on the downside by the 30-wk MA and on the top, by the high of 2064 established a month ago on 01/08. Although it did go a little higher intraday on Friday, the close kept it from going outside of the range.
Since the 2093 high, the trading pattern represents a loss of upside momentum, but not necessarily a topping formtion; it could be a large consolidation in an uptrend. If prices break out of the range on the downside, it could be the former. One could make a case for either but it would be strictly guess work. The market itself will be the final arbiter.
That having been said, the oscillators do lean toward the negative until they give a new buy signal. At the minimum, they would have to make a bullish cross, but even that would not be conclusive if they fail to follow through. Perhaps next week will clarify the situation.
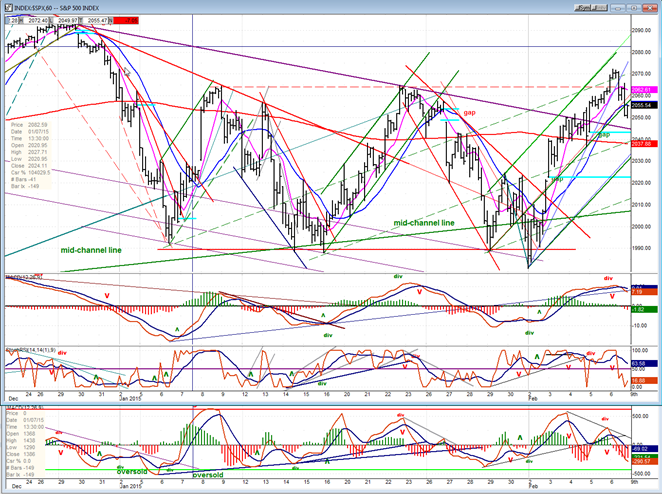
I am showing the daily chart with closes only. Since the oscillators are geared to the close, this makes for a truer comparison with price.

I want to point out a couple of things on the chart itself. What is really acting as support for the lows is a combination of the 120 DMA with the mid-channel line. It’s no wonder that it’s a tough level to break. And just below lies the 200 DMA which was responsible for stopping last week’s decline when it was touched intraday. The other is that although Friday’s high exceeded 2064 by 8 points intraday, that level was not really breached since the index did not close above it.
Let’s now look at the oscillators and go directly to the A/D SRSI, since this is potentially the most revealing. Although a little less so, some negative divergence with price is clearly apparent in the A/D MACD (just above). That is a warning that the rally may be coming to an end. The question is: to what purpose? Are we just going to pause? Or are we preparing to retrace and challenge the powerful support level one more time? It’s likely that next week will give us a clear answer.
The hourly chart gives us a good feel for the structure of the move from the 1980 low of 2/02. It is outlined within a green channel which almost replicates an Andrews pitchfork pattern. Some minor signs of weakness appeared when the index failed to make it to the top of the channel and subsequently broke below the mid-channel line where it could try to hold temporarily before moving to the bottom of the chanel. If it does, this should provide support and generate at least a bounce. If it fails to make it back into the top portion of the channel, it would be a sign of weakness; and turning down again might lead to leaving the channel entirely.
The A/D action was very instructive early on Friday. Even with the rally after the jobs report, it went negative almost immediately. This placed the oscillator in an immediate downtrend after making a strong showing of negative divergence -- a warning that a top was being formed. The MACD also gave a warning, but we had to wait for the overbought SRSI to turn before the decline started.
At the end of the day, the oscillators did not appear to have completed their downward trend and, unless there is a very strong opening, perhaps there will only be a small bounce followed by more decline. The nature of this decline could give us some insight into the market’s strength. There has been enough distribution to make the lower channel line a likely target – at a minimum – unless we extend the rally immediately.
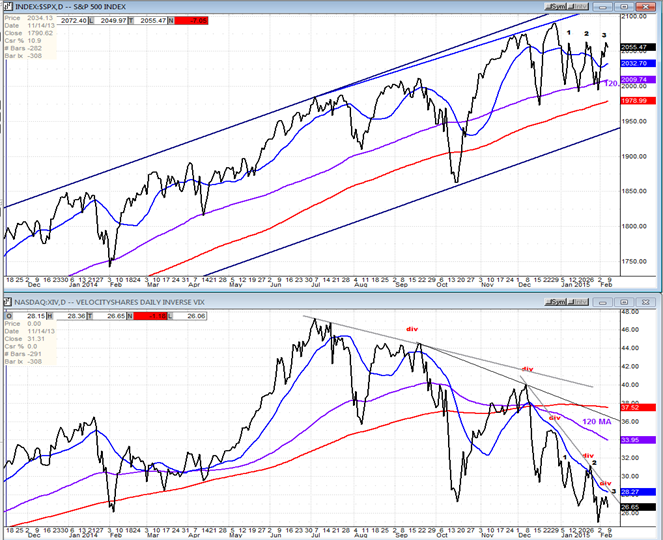
XIV (Inverse NYSE Volatility Index) - Leads and confirms market reversals.
Below, the action of the XIV (bottom chart) is compared to that of SPX for a little over a year. You can see that it was very good at calling an impending top in the market. Its persistent downtrend does not suggest that the consolidation in the SPX is over. On the contrary, by making lower lows, the suggestion is that more decline is coming. We might even get a hint of what kind of decline. If you compare the #2 top to the #1 top in both charts, you find that they rose to approximately the same level. However, the difference of levels between tops #3 and #2 is far more severe, perhaps warning us that caution should be exercised in the near future if you are a bull!
XLF (Financial Sector SPDR) - Historically a market leader.
The financial index found support near the bottom of its bullish channel and had a good bounce. We’ll now see if it is capable of resuming its uptrend or if it intends to test the lower trend line one more time.

XBD (American securities Broker/Dealer)
The exact wording for XLF (above) also applies to XBD!

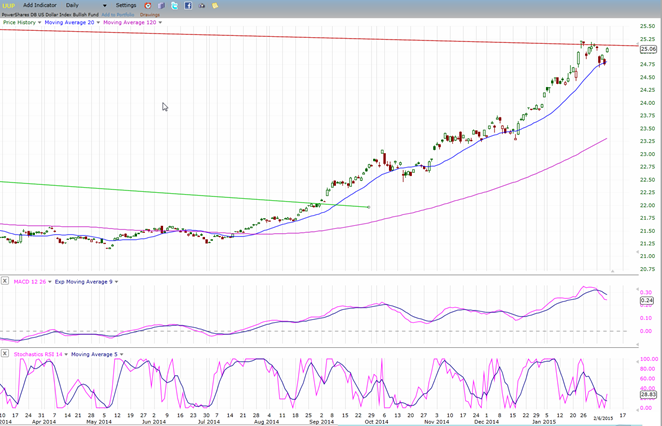
UUP (dollar ETF)
As expected, UUP is taking advantage of its top channel line to catch its breath. It could be there for a while if it does not make it through on the next attempt. However, the indicators are favorable to more upside.
GLD (Gold trust)
GLD’s tepid upward progress was halted once again at the mid-channel resistance. If it takes another shot at it and goes through, it will find more resistance at its 120-DMA whose level corresponds to the next potential count. I should remark that the strength in the dollar could have had much more of an effect on gold. In that sense, GLD is showing relative strength to the dollar. Will that lead to a bigger rally?

USO (US Oil Fund)
USO has had the best bounce of its 22-point free fall. Unfortunately, this is all it may get for a while since it has potentially exhausted the count derived from the small base that it had created. At best, it could go to 21.5 before retracing. Since it has the potential for declining as low as 11-12, it may not stick around this level very long, especially if UUP (above) does not waste any time in breaking out of its long-term consolidtion channel. While GLD responded minimally to the dollar strength, the move in oil has an almost exact inverse correlation to that of UUP.

Summary
SPX is at an inflection point! If it does not continue to rally, but extends its Friday decline instead, it could pick-up enough downside momentum to re-test the 1880 low and perhaps even break below the level which has supported it for the past month.
Its intentions could be revealed as early as the first half of next week.
********
FREE TRIAL SUBSCRIPTON
Market Turning Points is an uncommonly dependable, reasonably priced service providing intra-day market updates, a daily Market Summary, and detailed weekend reports. It is ideally suited to traders, but it can also be valuable to investors since highly accurate longer-term price projections are provided using Point & Figure analysis and Fibonacci projections. Reversal estimates are obtained from cycle analysis, an increasing use of EWT for structural analysis, and a thorough understanding of conventional technical analysis.
For a FREE 4-week trial, send an email to: [email protected]
For further subscription options, payment plans, weekly newsletters, and for general information, I encourage you to visit my website at www.marketurningpoints.com. By clicking on “Free Newsletter” you can get a preview of the latest newsletter which is normally posted on Sunday afternoon (unless it happens to be a 3-day weekend in which case it could be posted on Monday).
The above comments and those made in the daily updates and the Market Summary about the financial markets are based purely on what I consider to be sound technical analysis principles. They represent my own opinion and are not meant to be construed as trading or investment advice, but are offered as an analytical point of view which might be of interest to those who follow stock market cycles and technical analysis.

When Andre Gratian was a stock broker years ago, a friend introduced him to technical analysis of the market. Consequently, it is not an exaggeration to say that Andre fell in love with this approach! Ever since then, it has become an increasingly important part of his professional life. Gratian has studied the works of Wyckoff, Edwards & Magee, Edward J. Dewey (cycles) and many others. However, one of my most profitable undertaking has probably been to study Point & Figure charting, which he finds invaluable in analyzing stocks and indices. If he were restricted to one methodology, this is the one that he would choose. This well-rounded background has given him what he feels to be a special insight into the stock market, facilitating the recognition of meaningful patterns and the ‘turning points’ in all trends, whether they be short or long term. Andre feels very comfortable discussing the stock market and passing on meaningful information to others. His subscribers include individuals and money managers throughout the world. Moreover, his Newsletters are currently published on several financial sites, here and abroad.


