Mergers and Market Tops


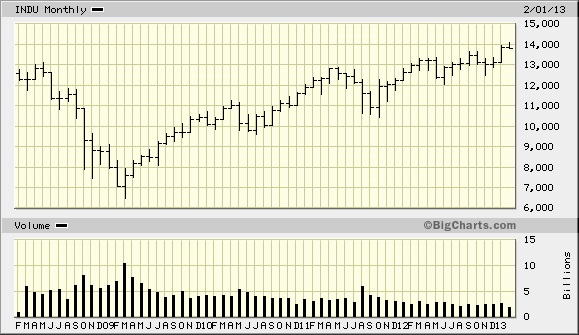
A prominent feature of the stock market recovery since 2009 has been the declining trading volume trend. NYSE trading volume has visibly diminished over the last four years after reaching a climax in March 2009 (see below chart).
To many savvy investors this is a negative sign which forebodes disaster. A declining volume trend suggests a lack of broad-based participation; and while it’s true that this is detrimental to the market’s long-term health, the dynamics of today’s market have changed from that of yesteryear. A market can rally on declining volume for weeks, months or even year at a time without seriously jeopardizing the market’s forward momentum. What’s the reason for this anomaly?
The reason for this can be found in an understanding of liquidity. When the Federal Reserve unleashed its easy money policy four years ago, it opened the floodgates of liquidity which allowed the equity market to bounce back from the credit crisis. Some of this money was channeled into the financial market via institutional trading, but much of it was used by corporations for stock buybacks, dividends and, more recently, corporate mergers and acquisitions. This explains how the bull market to date has been a volume affair: cash-rich companies have been the driving force behind it, taking the place of broad participation among individual investors.
As Randall Forsyth observed in the latest Barron’s, “It’s more likely that the oceans of liquidity loosed by the world’s central banks and sitting idly on corporate balance sheets spurred the burst of deal-making…” Examples include the $23 billion acquisition of H.J. Heinz by Berkshire Hathaway and Brazilian firm 3G Capital, Comcast’s $16.7 billion purchase of the 49% of NBC Universal from General Electric it didn’t previous own, Dell’s $24 billion proposed leveraged buyout, the $11 billion merger between bankrupt AMR and US Airways Group, and the $16 billion merger of Liberty Global and Virgin Media.
“All told,” writes Forsyth, “some $160 billion of M&A deals have been announced so far in 2013, the fastest start to a year since 2005, according to Dealogic data cited by the Wall Street Journal.
But doesn’t the increasing wave of mergers harbinger a major top? Historically, feverish merger activity does tend to coincide with major equity market peaks and this time should prove no different. The devil is in the details, however. In other words, timing is by no means an easy affair if M&A activity is your sole guide.
A more practical solution is to incorporate technical analysis along with market psychology and other reliable guideposts for the timing of the market’s inevitable top and use the M&A boom as merely anecdotal evidence that we’re getting close to one. Just be sure and leave plenty of leeway for the “whipsaws” that are sure to come between now and the time of the final “hard down” phase of the deflationary long-term cycle.
It’s my contention that 2013 will prove to be a topside transition year in much the way that 2007 was. You’ll recall that 2007 showed a similar level of M&A activity, and this presaged a major top which was confirmed the following year. The low NYSE trading volume of the last four years, supported as it has been by corporate buybacks and consolidations, can only keep the rally alive for so long. The 120-year cycle bottom in late 2014 should provide the finishing blow to this by allowing deflation to take its ultimate course against the Fed’s feverish attempts at creating artificial inflation.
Gold
The latest CFTC data show that traders have reduced long positions for gold prices by 56 percent since last October. Sharps Pixley also points out that the volume of gold-backed ETPs has declined 0.9 percent this year. Hedge fund manager extraordinaire George Soros reportedly cut his holdings in GLD ETFs by 56 percent in Q4 while Moore Capital liquidated all its GLD ETFs.
Consider also the latest technical development for gold and the gold ETFs: for only the second time since 2001, the 450-day moving average has been decisively broken by the gold and gold ETF price lines. What’s so important about this event you may ask? Unlike the last time the 450-day MA was violated (briefly) during the 2008 credit crisis, relative strength for gold was increasing at that time. Moreover, trading volume expanded noticeably during the 2008 violation of the 450-day MA, which indicated both capitulation on the part of retail traders and heavy accumulation on the part of “smart money” investors. This time around there is no such increase in relative strength, but rather a decrease in relative strength. Trading volume has also diminished rather than expanded.
The following chart is courtesy of Don Hays Market Advisory. Hays pointed out the relevance of the recent breakdown below gold’s 450-day trend line in a recent market commentary. He has always referred to gold as the “Fear Index” based on his belief that the price of gold is primarily function of investor risk aversion at the expense of equities.

Below is a graph showing the relative strength for the iShares Gold Trust ETF (IAU). As you can see here, relative strength for the gold ETF has been declining for some time, which doesn’t exactly inspire confidence in the outlook for gold right now.

The implication is that gold is still in an intermediate-term bear market which will require a polar shift of both investor sentiment and money flow in order to reverse it.
2014: America's Date With Destiny
Take a journey into the future with me as we discover what the future may unfold in the fateful period leading up to - and following - the 120-year cycle bottom in late 2014.
Picking up where I left off in my previous work, The Stock Market Cycles, I expand on the Kress cycle narrative and explain how the 120-year Mega cycle influences the market, the economy and other aspects of American life and culture. My latest book, 2014: America's Date With Destiny, examines the most vital issues facing America and the global economy in the 2-3 years ahead.
The new book explains that the credit crisis of 2008 was merely the prelude in an intensifying global credit storm. If the basis for my prediction continue true to form - namely the long-term Kress cycles - the worst part of the crisis lies ahead in the years 2013-2014. The book is now available for sale at:
www.clifdroke.com/books/destiny.html
Order today to receive your autographed copy and a FREE 1-month trial subscription to the Gold & Silver Stock Report newsletter. Published twice each week, the newsletter uses the method described in this book for making profitable trades among the actively traded gold mining shares.
Clif Droke is the editor of Gold & Silver Stock Report, published each Tuesday and Thursday. He is also the author of numerous books, including most recently, "2014: America's Date With Destiny." For more information visit www.clifdroke.com


