Preparing For The Crash As Earnings Crumble And Buybacks Exhaust Themselves...


 As you know I am primarily a chart analyst, so when I come across fundamental analysis that really gets to the bottom of what is going on I like to share it with you. It is of the utmost importance that such analysis and the info therein is either not known to the market at large or its significance is not appreciated – by the time most fundamental information becomes known it is too late – it has already been factored into prices, which is a big reason for using charts. The two key points not grasped by the market right now that are set out in the excellent article The Return of the Business Cycle by Phoenix Capital Research are firstly that stock prices in the US have been artificially inflated by large scale stock buybacks, motivated by greed on the part of senior executives who are trying to drive the stock price up because they are paid in options, with corporate coffers being emptied to engage in these buybacks and debt being used to amplify the buybacks even more. The second point is that the strong dollar is now having a huge impact on corporate profits, which are deteriorating at an alarming rate, and if we see another strong dollar up-leg, which the writer of this fundamental article expects, it will make the situation even worse and should prove to be the last straw for the stock market.
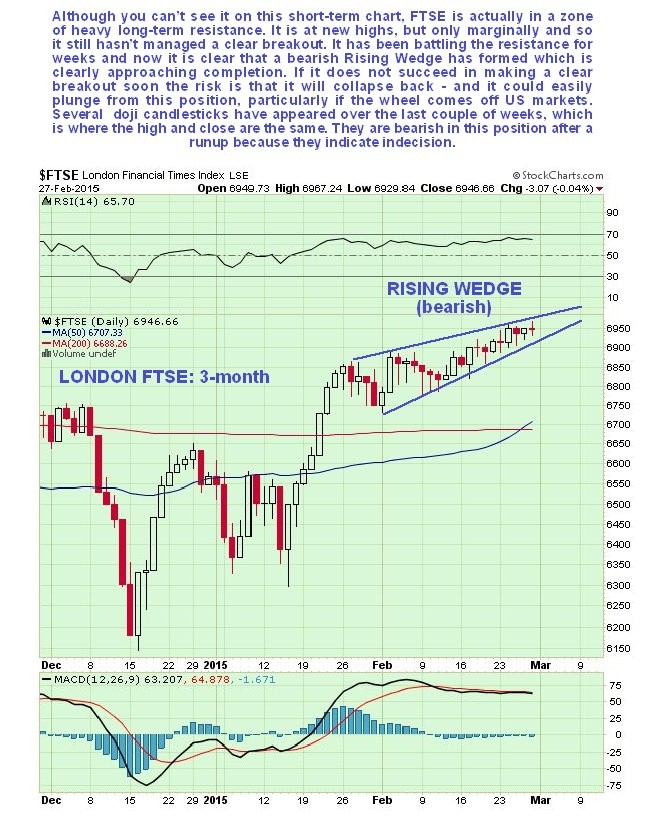
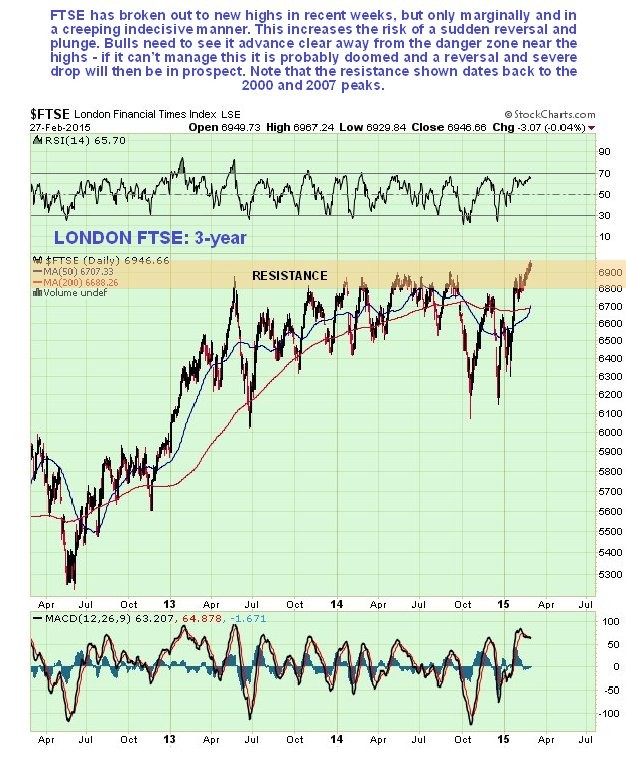
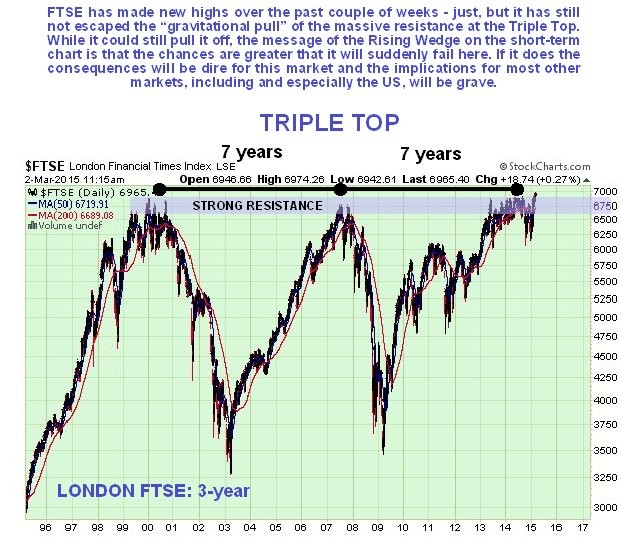
Thus it is interesting for us to observe that various markets are at a critical juncture. You may recall us looking at the London FTSE index, where a giant epochal Triple Top has formed. In recent weeks this index has crept higher and has started to make new highs, but so far these new highs are marginal, and it still hasn’t escaped the gravitational pull (resistance) of the 3 huge peaks. However, the current uptrend may be the harbinger of an imminent collapse, because it is a quite strongly converging bearish Rising Wedge, with its occurrence at the 3rd peak of a giant Triple Top pattern making it all the more ominous. FTSE must get on with it and advance smartly away from the danger zone, to avert the risk of a reversal here that would be expected to lead to a severe decline, which doubtless would involve most markets, including and especially the over-inflated US markets. If that happens a later consequence will be that the insanely inflated London property (and others) will CRATER.
Three charts for the London FTSE are presented below, a short-term 3-month one showing how the recent uptrend has taken the form of a bearish Rising Wedge, a medium-term 2-year chart showing how, although the market has just made new highs, it is still within the “gravitational pull” of strong long-term resistance, and a long-term 20-year one showing the massive epochal Triple Top.
Alright, so how do US markets look? Adam Hamilton and others have been calling these markets down for ages now, but they have just kept on going up and up, fuelled by Fed largesse, capital inflows from other parts of the world that are less stable and have even lower interest rates – negative in parts of Europe – and by mergers and stock buybacks of the kind that occurred on a large scale in the roaring 20’s leading into the 29 crash, which lead to an era when Laurel & Hardy provided some temporary relief from the hardships of the time.
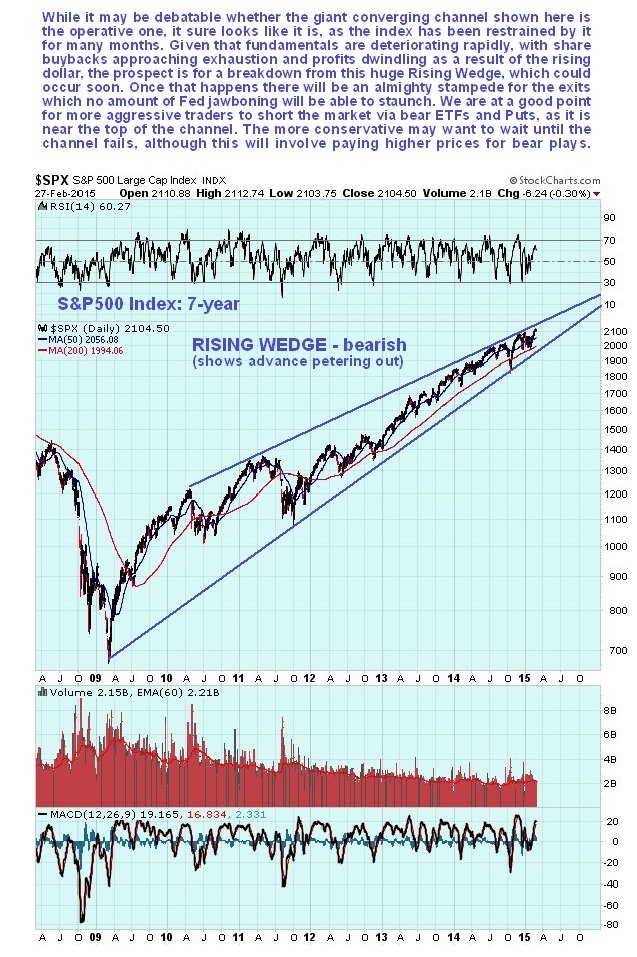
If we look at the long-term chart for the S&P500 index we that that, although it has risen to well above its 2000 and 2007 peaks, unlike the London FTSE, the rally has been going on for a long time now, virtually without a correction, which makes a bear market likely soon purely on a cyclical basis – and as we have seen there will be plenty enough reasons for a bear market soon enough. Fortunately, because of the long persistent uptrend since 2009 it will be obvious when this party finally come to an end. What will distinguish the onset of a serious bear market from just another “buy the dip” correction that we have seen thus far will likely be a particularly brutal steep plunge accompanied by huge volume – an absolute stampede for the exists – that leads to a clear breakdown from the uptrend channel. Considering how wildly overvalued the market is and the extremes of sentiment it is unlikely that it will just “fade away” – it should be dramatic. Once it goes the site of the Fed and other Central Banks trying to stop it will be like watching someone trying to put out a gas station fire with a watering can.
Of course we don’t have to wait for such wild action to start taking bearish positions. Corporate profits are collapsing NOW, a process that is set to continue, particularly if the dollar has another upleg, so the writing is already on the wall. So while we are well aware of the danger of being right too soon – and the cemeteries of Wall St are already busting with bears who were right too soon over the past couple of years - there comes a time when it makes sense to “put your best foot forward” and that time is now, as far as shorting the market is concerned, especially as it looks like it is starting lower again after its latest up-leg to new highs.
This article is not some rambling academic treatise – the point of writing all this is to focus attention on the major opportunity that will be cloaked in what should turn out to be crisis and calamity for most. Our goal is to capitalize on what is believed to be an imminent major bear market. From the standpoint of timing there are two approaches – short the market right away since it is just turning down after making a new high, so timing may be optimal, or wait until we have clear evidence of a major breakdown, which is the more expensive but more sure route. The former is favored although it takes more courage. The vehicles to be used for the purpose of making money on the way down may be chosen from straight shorting of stocks likely to drop hard, bear ETFs, which are an easy and comfortable way to play it, and Put options for more experienced and aggressive traders.
The following was added to this article on 4th March.
In addition to the core fundamental reasons for the market to cave in set out above we have a whole raft of technical indicators showing that the broad US stock market is either at or very close to an important top and that are calling for, at the least, a severe correction and at worst a crash. If, after looking at the evidence presented above and the indicators presented below you are still positive on the market, you are either willfully ignorant or stupid.
Let’s take a look at some of these indicators now.
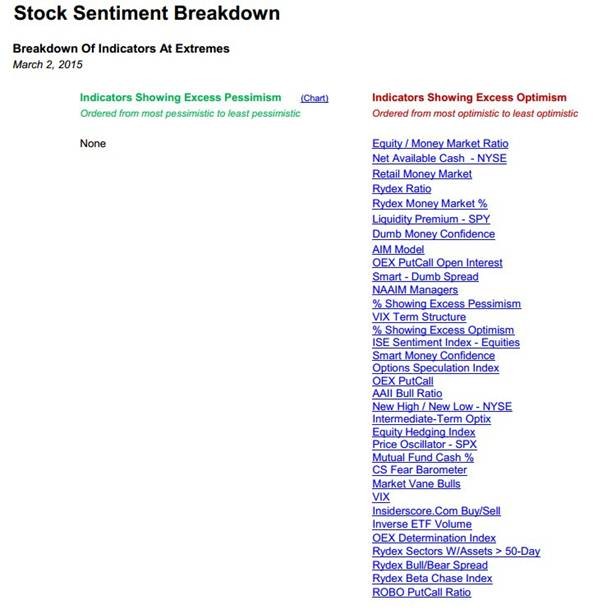
We start with a table showing the indicators that are either at bullish or bearish extremes. As you can see there are a lot at bearish extremes and NONE at bullish extremes. This speaks for itself.
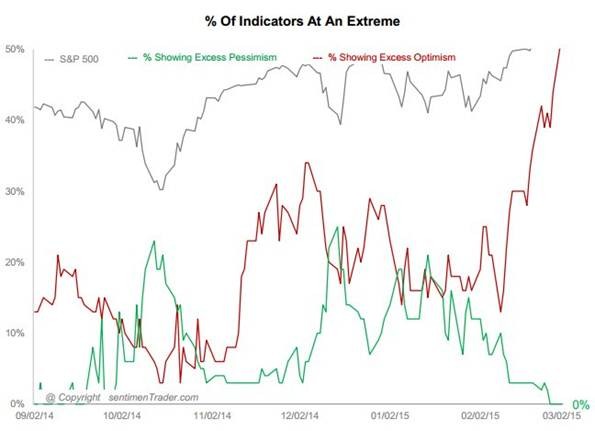
The percentage of indicators at extremes is shown on the chart below, and you can see how the latest reading relates to readings over the past year on this chart…
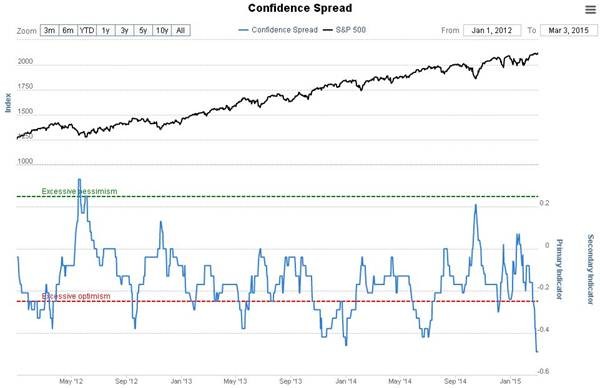
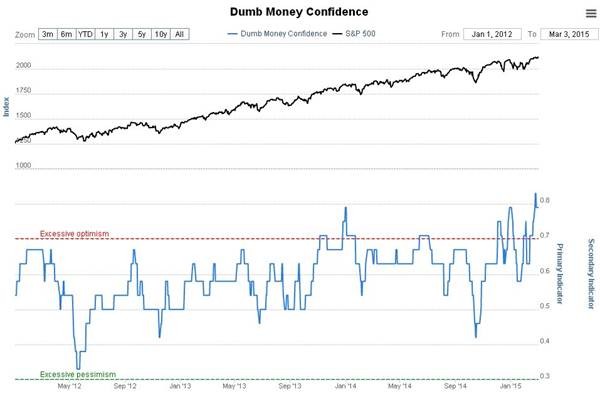
The Confidence Spread, which is the difference between so called Dumb Money optimism and Smart Money Optimism is shown on the following chart which goes back about 3 years – as we can see it is at a really extreme reading…
Dumb Money has been record confident on the latest broad market high, which is of course a warning to expect trouble…
And for good measure we also have the fear barometer at record lows…

I don’t ever remember seeing a time when so many indicators were at such extremes. I view this as EXTREMELY BEARISH for the stock market, even if it holds up for a while. This is why we are going for bear ETFs.
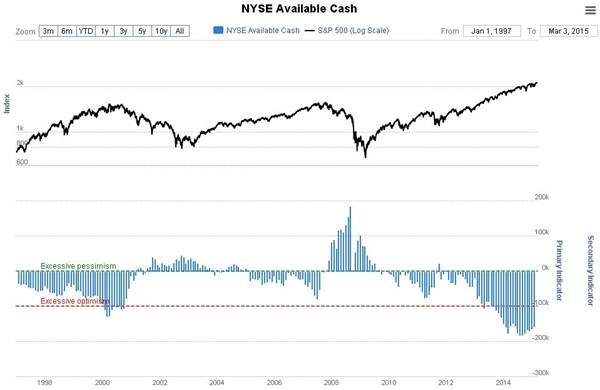
Lastly we look at the chart for NYSE available cash, which is at a record negative extreme. In the past lesser extremes have marked major market tops as this chart, which goes back to the late 90’s, shows…
Sentiment charts shown above courtesy of www.sentimentrader.com
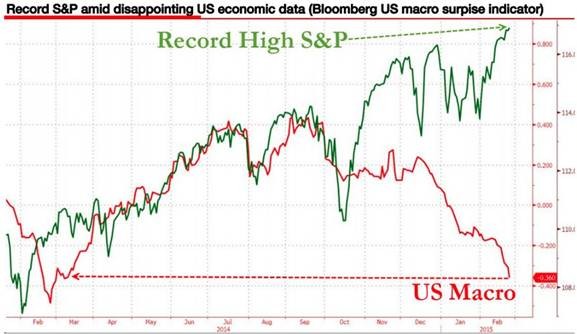
Finally the following chart relates to the fundamental point raised above about the yawning disparity between earnings and stock prices…
These indicators taken together show that BIG trouble is not far over the horizon.
The purpose of this update is to get you out of harm’s way, to the extent that you are in it, ahead of time, and more than that to prepare you to capitalize on it big time. Small time Mom & Pop investors who have been goaded into the market at the worst possible time by the mainstream financial press in recent months will be eviscerated. It is considered highly probable that the Precious Metals will get caught up temporarily in this maelstrom, as in 2008, and they are to be avoided or shorted too, with an eye to buying gold and silver related investments aggressively as gold and silver approach our target zone, which for gold is between $850 and $1000, ahead of the entire rotten debt edifice crashing down, which will result in gold and silver soaring.
********
Courtesy of http://www.clivemaund.com

Clive P. Maund’s interest in markets started when, as an aimless youth searching for direction in his mid-20’s, he inherited some money. Unfortunately it was not enough to live a utopian lifestyle as a playboy or retire very young. Therefore on the advice of his brother, he bought a load of British Petroleum stock, which promptly went up 20% in the space of a few weeks. Clive sold them at the top…which really fired his imagination. The prospect of being able to buy securities and sell them later at a higher price, and make money for doing little or no work was most attractive – and so the quest began, especially as he had been further stoked up by watching from the sidelines with a mixture of fascination and envy as fortunes were made in the roaring gold and silver bull market of the late 70’s.
Clive furthered his education in Technical Analysis or charting by ordering various good books from the US and by applying what he learned at work on an everyday basis. He also obtained the UK Society of Technical Analysts’ Diploma.
The years following 2005 saw the boom phase of the Gold and Silver bull market, until they peaked in late 2011. While there is ongoing debate about whether that was the final high, it is not believed to be because of the continuing global debasement of fiat currency. The bear market since 2011 is viewed as being very similar to the 2-year reaction in the mid-70’s, which was preceded by a powerful advance and was followed by a gigantic parabolic price ramp. Moreover, Precious Metals should come back into their own when the various asset bubbles elsewhere burst, which looks set to happen anytime soon.
Visit Clive at his website: CliveMaund.com


