A Shallow Correction?


Market Overview
“SPX is poised to reach the high of the B-wave, perhaps by making it to the 2410 alternate projection…”
In fact, the high of the move came last Monday, falling short of 2410 by six points. Whether or not this is the top of the B-wave remains to be seen. In any case, the C-wave may turn out to be shallow. The second intermediate cycle expected to bottom in this time frame came last week after a three-day decline of 22 points which was followed by an immediate reversal higher. I had expected something deeper and more prolonged from this cycle, but the fact that this is the only weakness it could produce attests to the underlying market strength. The third and final one is due at the end of the month. Had these three intermediate cycles clustered more closely together, they might have given us a deeper correction. But they are spaced far enough apart to be fighting one another instead of cooperating.
Erik Hadik has correctly identified a 17-year top occurring this year, but this is not a cycle which can produce much weakness until its declining phase is farther along. He does speak of several other – even longer – cycles which are having an adverse effect on the market. This could be; but, for the moment, at least, it does not look like a market which is quite ready to crash.
Analysis: (These Charts and subsequent ones courtesy of QCharts.com)
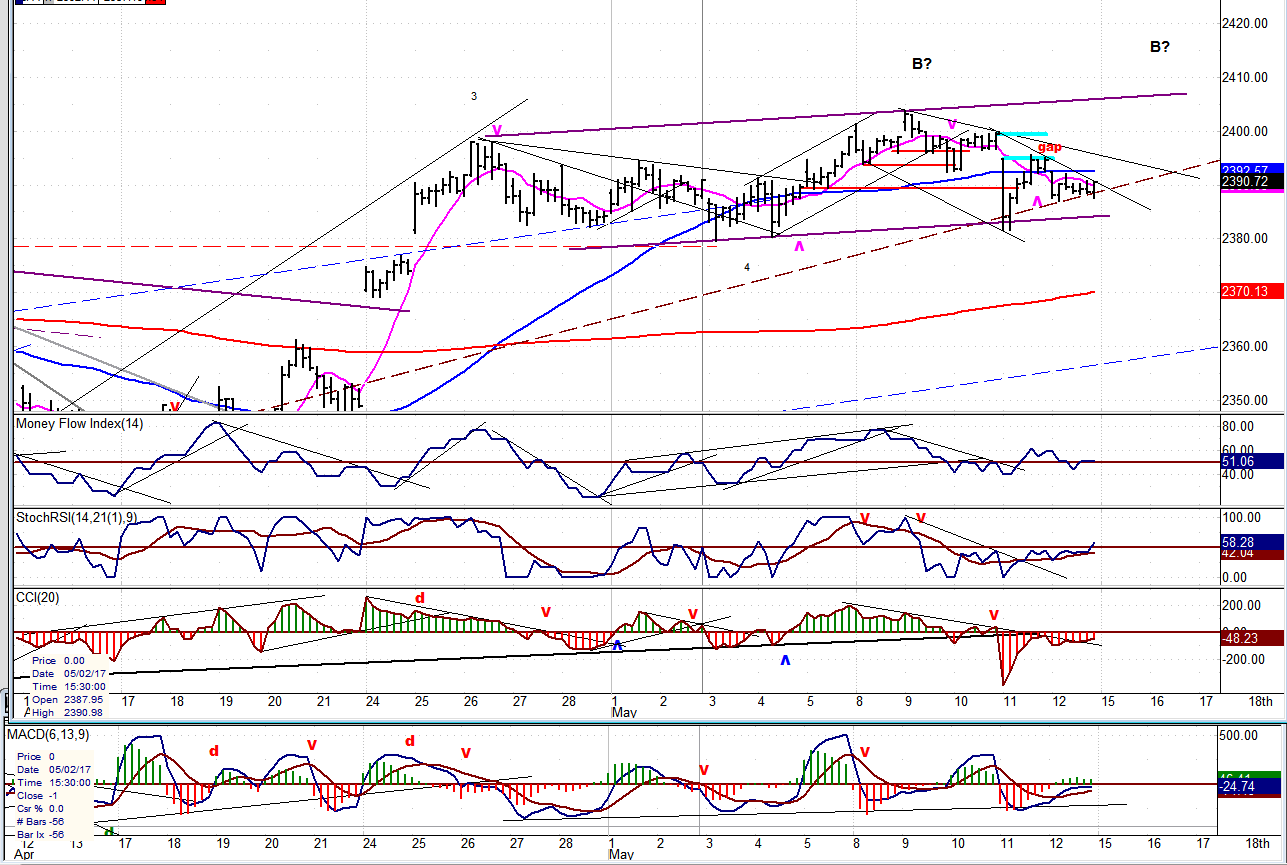
Daily Chart
SPX made an initial high in early March and, after correcting down to 2322, it rallied to print a new high of 2403 last Monday. An intermediate cycle (and several other minor bottoming cycles) should bring it back down by the end of the month/early June. Between now and then, it’s not inconceivable that it could make a new high, and finally reach 2410. If this new high turns out to be the elusive B-wave, then the C-wave low could be pushed back all the way into August and produce a decline more appropriate for this correction.
The alternative would be that the C-wave is completed by early June in a very shallow correction which might not even breach 2380. If that turns out to be the case, a new uptrend could start at that time which could next reach the low 2500’s. Of course, this is speculative, but we must consider the various options.
The market is playing it close to the vest right now and it will only lift one veil at a time. More should be revealed next week. The hourly indicators appear ready to forecast another minor uptrend starting on Monday. We do not yet have a buy signal but it would make sense that the cycle bottoming last week should push prices a little higher, and there has been enough accumulation for a rally back to the recent high.
The daily momentum oscillators reflect a slightly overbought market condition and they should continue to correct before they can get back into a buy signal mode. If, as the 60-m chart suggests, we are ready to move a little higher, it will delay that process even more.

Hourly Chart
After having a quick bounce from 2322 to 2398, the index has traded in a narrow range -- outlined on the chart by two heavy purple lines. After making a high of 2304 (which was assumed to be the B-wave of the correction), an attempt at going through the low of that range and expanding into a full-blown C-wave failed when strong buying occurred at that low. Since then, a small base has been formed, and this action has brought the oscillators to the verge of giving a buy signal. If the quick decline/rally was in fact caused by a bottoming cycle, the odds favor a move to the upside from here. The small base has the potential of taking the index back up to its recent high of 2403 and perhaps even higher. However, another intermediate cycle low (along with two minor ones) due at the end of the month should prevent this move from being a genuine resumption of the long-term trend.
The current (known) cyclical configuration may prevent wave-C from expanding to its full potential and confine the decline to a shallow correction. If, however, there are (unknown) longer cycles influencing price action, then Wave-C could take the index down a hundred points or more, before it is complete. A price break below 2380 would signal that this process is underway.
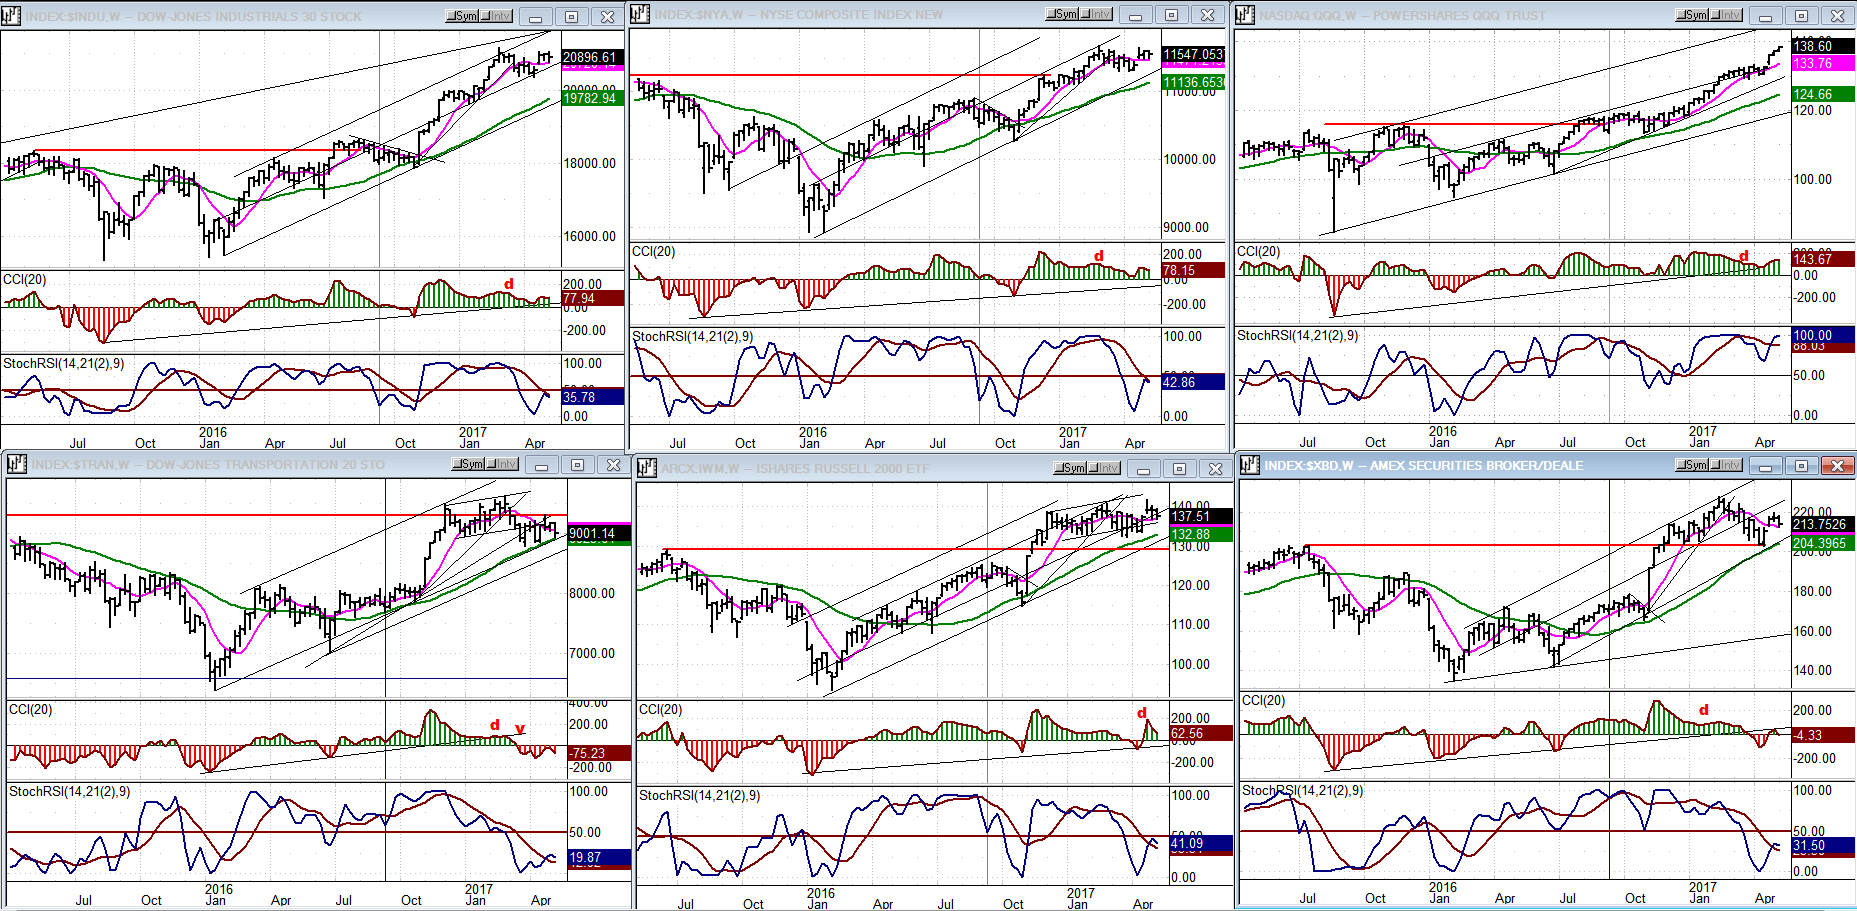
An Overview Of Some Important Indexes (Weekly Charts)
Last week, most of the following indexes went sideways, except for the the QQQ which, again, made a new high. The oscillators of the other indexes suggest that they are in various stages of a corrective mode. This is consistent with the current position of SPX. It is a fair guess that QQQ will have to join them before we can resume the long-term uptrend.
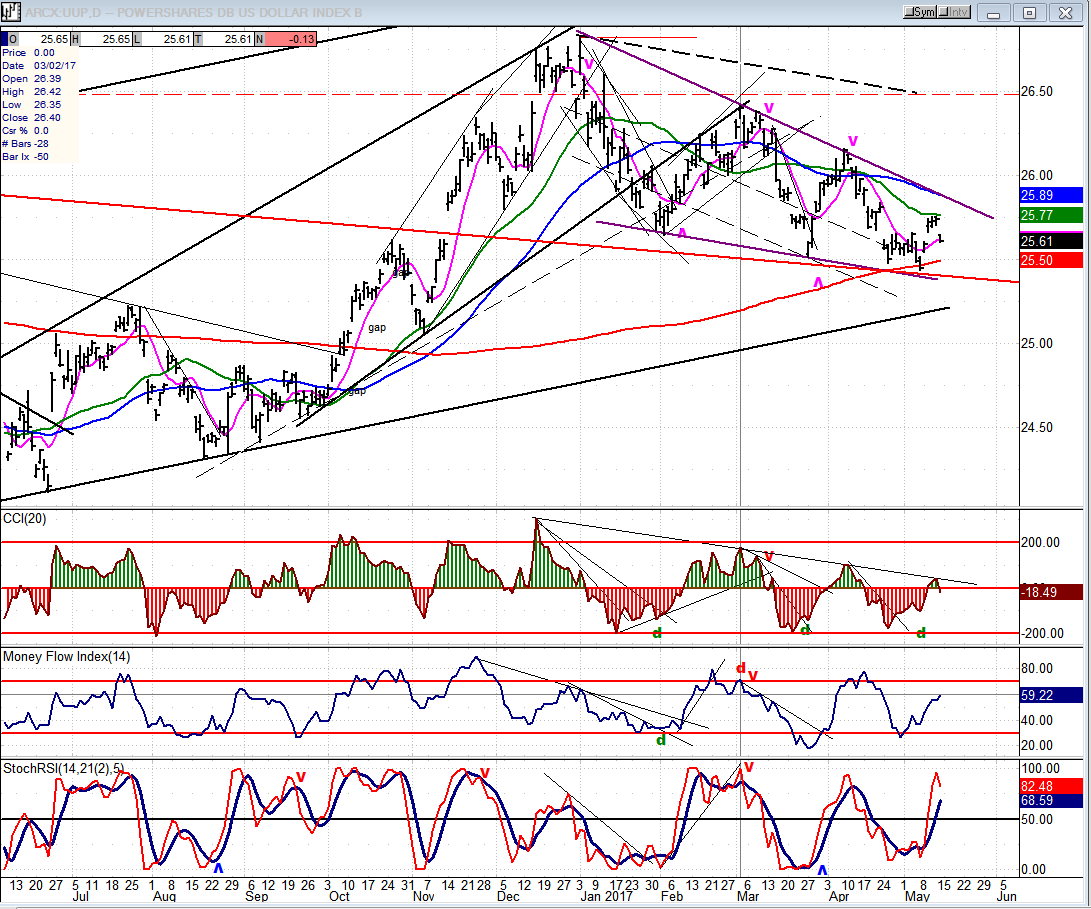
UUP (Dollar ETF)
UUP did find support where it should have and has rebounded in what should be the first phase of a more extended rally. To prove that it still has many faithful followers, it will have to move out of its declining wedge pattern, and above the top trend line.
GDX (Gold Miners ETF)
GDX had a strong rebound after making an early cyclical low. It has reached an area of resistance which should soon bring a correction. We will have to see more follow-through strength before we can determine whether or not this is the beginning of an important move. I doubt that it is for the simple reason that the P&F chart needs to do some backing and filling before a base has been established.
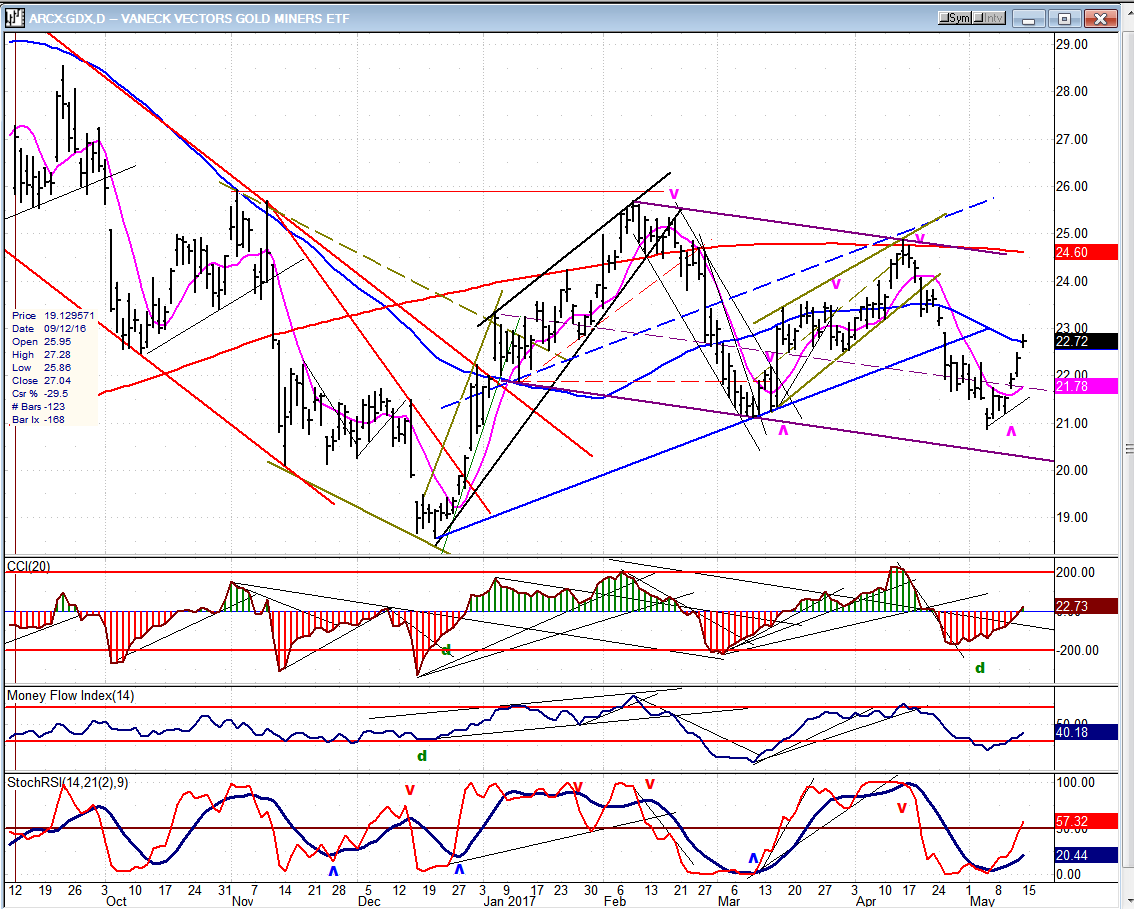
Note: GDX is now updated for subscribers throughout the day, along with SPX.
USO (US Oil Fund)
USO has found support on its lower channel line and bounced. It may have to do more consolidation below the trend lines that it just broke, before it can rise above them again. In any case, it has reverted to another intermediate corrective channel and should not be of interest to bulls until it shows signs of wanting to break out of it.

Summary
SPX continues to correct, but the nature of that correction is still unclear. We could be ready for a resumption of the uptrend after only a couple of weeks. However, if we fail to do so, we could be extending the time factor until a more substantial decline of a hundred points or more has taken place.
A decline of this magnitude would be more appropriate to the structural correction taking place.
********
For a FREE 4-week trial, send an email to [email protected], or go to www.marketurningpoints.com and click on “subscribe”. There, you will also find subscription options, payment plans, weekly newsletters, and general information. By clicking on "Free Newsletter" you can get a preview of the latest newsletter which is normally posted on Sunday afternoon (unless it happens to be a 3-day weekend, in which case it could be posted on Monday).
The above comments and those made in the daily updates and the Market Summary about the financial markets are based purely on what I consider to be sound technical analysis principles. They represent my own opinion and are not meant to be construed as trading or investment advice, but are offered as an analytical point f view which might be of interest to those who follow stock market cycles and technical analysis.
********

When Andre Gratian was a stock broker years ago, a friend introduced him to technical analysis of the market. Consequently, it is not an exaggeration to say that Andre fell in love with this approach! Ever since then, it has become an increasingly important part of his professional life. Gratian has studied the works of Wyckoff, Edwards & Magee, Edward J. Dewey (cycles) and many others. However, one of my most profitable undertaking has probably been to study Point & Figure charting, which he finds invaluable in analyzing stocks and indices. If he were restricted to one methodology, this is the one that he would choose. This well-rounded background has given him what he feels to be a special insight into the stock market, facilitating the recognition of meaningful patterns and the ‘turning points’ in all trends, whether they be short or long term. Andre feels very comfortable discussing the stock market and passing on meaningful information to others. His subscribers include individuals and money managers throughout the world. Moreover, his Newsletters are currently published on several financial sites, here and abroad.


