Shanghai Index To Fall 80% From Its Peak…While S&P500 Declines A Further 33% To 50%


 This article is intended to hit the reader like a brick in the face, because quiet reasoning doesn’t seem to have any impact at all.
Here’s the proposition that needs to be considered:
If the Chinese authorities are unable to hold the Shanghai Index above the 3,000 level, then volumes of shares traded will increase. Prices will fall sharply as investors rush to exit their investments. Ultimately, the Shanghai Index could fall as low as 1,000 based on the chart below. The reasoning behind this conclusion flows from technical analysis techniques and is laid out in simple English beneath the chart.
Importantly, what is set out below is not a “trader’s” view of the market. I am not a trader, I am a strategic thinker…and this is a strategic assessment – based on my almost 50 years of experience in analysing charts from a strategic perspective . The assessment below points to the possible (probable) unravelling of the Chinese equity market. In turn, this will likely be a lead indicator of the future state of the Chinese economy that has, historically, been suffering from serious misallocation of resources. The idea that the Chinese economic drivers can be shifted from Manufacture to Domestic Consumption and Services is pure codswallop. It is cloud cuckoo-land reasoning. By way of metaphor: A man who has no hair does not need the services of a barber. An out of work factory worker is not going to buy three pairs of Nike shoes and take out a life insurance policy. It’s time to get real.
Turning now to the chart above: As I’ve observed on many occasions before, a Head and Shoulders pattern is the most misdiagnosed pattern in technical analysis. To be a genuine pattern which points reliably to a coming trend reversal, the volume patterns need to confirm. In short, they do confirm. Specifically:
- There needs to be high volume (buying pressure) on the Left Hand Shoulder (tick)
- High volume (buying pressure) leading to the peak of the Head (tick)
- Volume falls away as the price falls on lack of buying to a level that is below the level of the shoulder’s peak. (tick)
- Anaemic volume as the price floats up before the direction turns down again as buyers lose confidence and fall away (tick)
- Volume starts to tentatively increase as the price reaches for the neckline because sellers begin to emerge (tick)
- There “may” be a technical reaction upwards at the neckline on low volume but, if/when that peters out, the price will likely come down savagely AFTER the neckline has been broken on the downside. Volume should explode upwards as shareholders bail out. Sell decisions might not be driven by the investors themselves but by those who funded their margin investments
- The time it takes to get to the 1,000 target (the same distance from the neckline on the downside as the distance of the peak of the head above the neckline – i.e. a FALL of 2,000 points) may be either short or extended, but the trend will likely continue on the downside until the 1,000 level is reached. This outcome does not driven by fundamental forces. It flows from the fairly predictable waxing and waning of animal spirits of human beings whose avaricious behaviour was excessively aggressive on the upside and who finally begin to understand on the downside that there is no such thing as a free lunch. Eventually, weakened investors “capitulate” and, finally, they “liquidate”; and they then become extraordinarily pessimistic in their views of the future. In turn, this impacts on their emotional propensity to consume beyond their means. In short, the economy follows the market.
Importantly, history shows that no single force on this planet can overcome the combined forces of the entire market. In the short to medium term this is possible (the crashing waves can be held back) but history has shown time and time and time again that the power of the tide cannot be managed. The probability that the Chinese authorities will keep the 3000 level intact by throwing money at the Shanghai market is virtually nil. It’s just a matter of time
At the end of the day, at the heart of a stable economy lies “confidence”. If the Investing public can have confidence that the financial authorities actually understand what’s happening when the markets start to head south – and that they have an appropriate plan of action that transcends political waffle to respond to the underlying economic challenges– then half the battle will be won.
Do they have such a plan? Well, I know that China has a 100 year plan to usurp leadership control over the global economy from the US (read The Hundred Year Marathon, by Michael Pillsbury) and I also understand that has a specific 100 year plan to switch over its energy infrastructure to nuclear (including Gen IV) but it seems to me that the people who formulated those plans do not understand the concept of “full” costing. Effectively, if one sells a product at less than its full cost then you incur a loss. And I wonder whether anyone in the Chinese politburo has costed the impact of the one child policy and/or the impact on the Chinese environment of unfettered industrial growth? Probably not. Even we in the west have merely been paying lip service to these costs. So maybe it’s time to get our heads around this simple idea: When you incur losses, you eat into capital. Ignoring full costs across the planet implies that humanity has been living off capital.
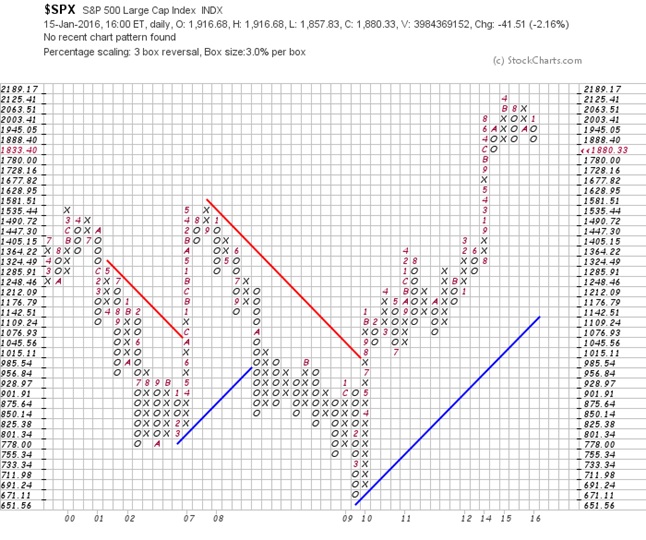
Turning our attention now to the US markets:
I have found the 3% X 3 box reversal Point & Figure charts to be the most accurate in making predictions FOLLOWING a break
The chart below of the $SPX hasn’t yet broken down but the shorter term P&F charts suggest that it will
The $SPX500 could go all the way back to the 1285 level and my view is that it will. Of interest, that level will still be above the blue line. I have a mate who has kept P&F charts dating back to 1992 and he tells me that an upward pointing trend-line that dates back to then is looking very vulnerable. Its pure speculation at this point but if the 1200 to 1300 support region doesn’t hold, the SPX could pull all the way back to 671on the chart below.
To put some perspective on it, have a look at the Dow Industrials chart (adjusted for inflation) dating back to 1900.
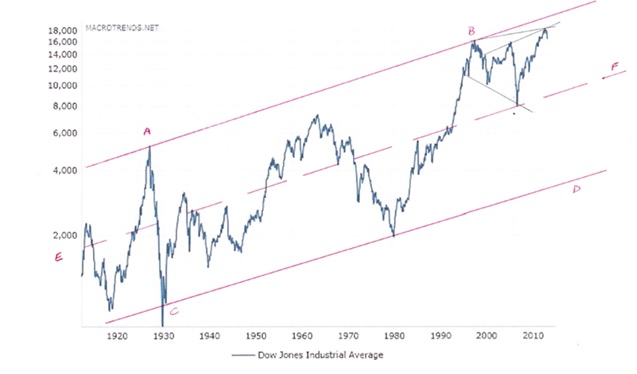
It seems reasonable to conclude that the Dow Index will not rise from this historically overbought point. Given that a broadening formation is typically bearish, we could see the Dow retracing to anywhere between line E-F and C-D depending on animal spirits of investors. My “guess” is that line E-F is more probable – maybe a 50% fall to around 8,000.
But let’s not get hysterical. If the Dow finds support at around 8,000 then the SPX should find support at around 900. In my view, where it actually lands up will be a function of fundamentals. How will governments react? Does it have a sensible – confidence rendering – plan? Who knows? I can’t see QE being relied on because QE was demonstrably losing its potency. Unfortunately guessing what the authorities will do is pure speculation. On the other hand, based on historical patterns, if the 3% X 3 box reversal chart gives a sell signal, it is reasonable to anticipate a long-term target of 1285. Thereafter it’s anyone’s guess.
From another perspective, it came to my attention yesterday that the US Fed had a meeting with bankers to determine how the US banks should handle the looming bad debts owed by the oil fracking industry. Apparently, the decision was to keep the debts on the books – unimpaired – in order to give the appearance of an adequate Tier-1 capital ratio. Some plan.
But let’s end this on a positive note. Behind the scenes there has been an enormous amount of R&D into the subject of Artificial Intelligence. Ignoring the hysteria surrounding machines taking over from humans (machines have no souls) the long term impact of AI will almost certainly be to improve the quality of human life and to reduce the burden on the planet’s environment through greater energy efficiency. In this writer’s view there is reason to be optimistic, but we need to embrace the idea that the Industrial Revolution has ended – which is why the world’s markets have been heading south – and that a new dawn awaits where “quality” will be more highly valued than “quantity”.
So, if you want to read some carefully researched conceptual plans, then read my two fact based novels which predicted what is now happening in the world’s financial markets and which point to a possible way forward. Beyond Neanderthal (published in 2008) and The Last Finesse (published in 2012) are both available in e-book format from Amazon and Barnes and Noble. If one looks beyond their story lines, both of those books might be looked upon as global long range strategic plans; and the combined investment therein will be around US$15. Here are the Kindle links:
Beyond Neanderthal: http://www.amazon.com/Beyond-Neanderthal-Brian-Bloom-ebook/dp/B007Z7GJH4/ref=sr_1_1?s=books&ie=UTF8&qid=1453064607&sr=1-1&keywords=brian+bloom+beyond+neanderthal
The Last Finesse: http://www.amazon.com/Last-Finesse-Brian-Bloom-ebook/dp/B00873GSQC/ref=sr_1_1?s=books&ie=UTF8&qid=1453064664&sr=1-1&keywords=brian+bloom+the+last+finesse
Of significance, both of these books are founded on a simple underlying thought construct:
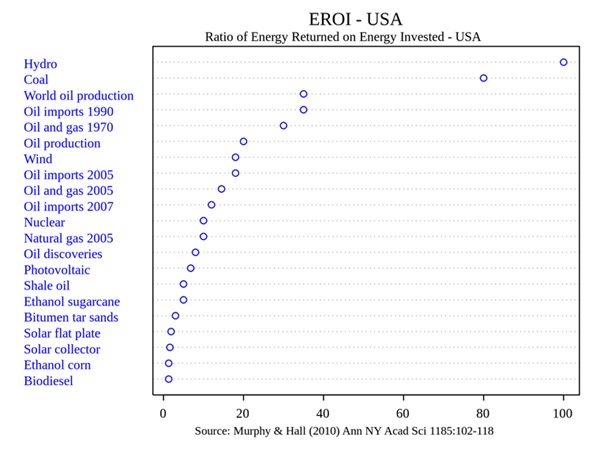
All of human civilisation is built on a foundation of artificial energy. 25 years ago the world-wide EROI of oil, for example was around 40:1 (see chart below: source Murphy and Hall). And the latest research shows a number closer to 17:1. Below 10:1, oil will lose its ability to produce net incremental energy. Coal is a pollutant and, regardless of one’s views on climate change, CO2 combines with moisture in the atmosphere and falls as rain that slowly leads to incremental acidification of our oceans. In simple English, the era of fossil fuels has passed its use-by date – and the idea that we can migrate to low Energy Return on Energy Invested energy paradigms such as solar power are currently pipe dreams. For example, although the EROI of solar will doubtless rise over time as we become more proficient in our R&D, have a look at the EROI of solar and photovoltaics in the chart below. It’s time to stop listening to opportunistic politicians talking nonsense about “alternative, clean” energy paradigms that will not do the job.
Conclusion
Bearing in mind that when interest rates rise, bond prices fall; and that when equity markets fall losses are incurred and the money supply shrinks as spare cash is used to pay down short term debts. When cash is king, the price of money rises. It’s not a difficult concept to grasp. The time has come to convert to cash and retain only selected “cherry picked” strategic investments, one of which will be those two fact-based novels. An investment of less than $15 is equivalent to three cups of Starbucks coffee. Maybe it’s time to start thinking outside the box.
Brian Bloom
Tea Gardens, NSW, Australia


