Smouldering Gold Price


Last week in US Markets it was thought that it has become time to light the fire – implying that with key long term-support for gold having been reached, the metals could now end the deep slide and begin to recover. This week’s heading still shows optimism, but there has as yet been no lift-off, despite the support holding up well. The good news is that FND for August is history and it is only the hurdle of the NFP next Friday that, in terms of what typically happens to gold on that day, has to be crossed before the metals can enjoy reduced downward pressure. Note though that until it all changes, it will not be a removal of this selling force, only a relaxation. At the same time, downward pressure is growing on Wall Street; last week has been quite fitful for the DJIA; despite a strong start to the week, the 18000 level is way out of reach still and as the week grew older so did ability to keep trying the make it back to that magic number.
Smouldering is nothing to get excited about; simmering would be better, but it is only when we see the flames shooting up that real excitement can take over. So far so good, though; much better than the fire going out completely! Something I am sure most people who organise barbeques must have experienced at least once.
Readers who have read ‘Can Lightning Strike Twice? ‘ will be aware that the Friday PM gold fix was right at major long term support for the gold price. When on June 30 of 2013, also a Friday, gold fixed at $1192, it was also right on similar support – and that saw a reversal in the steep down trend. Now this has happened again. The heading, unfortunately, given recent and not so recent history, compulsively has to end with the question mark; not to do so would place me in a dream world where technicals always work and where no interventionist forces exist. Nevertheless, this does not deter me from optimism and the hope, if not full belief, that it has in fact become time to light the fire in the PM markets, question marks notwithstanding.
Silver is still holding just above its support. Perhaps there is good support close by that has not been detected, or it can be the underlying strength that seems to have developed in silver that is keeping it more buoyant, if also more volatile, than gold. It is still my suspicion that silver is a greater problem in the control of the precious metals – and has been so for more than a year. There is just something different in the way silver behaves . . . not so obvious to me, but nagging away. Probably time will show and tell.
Just about everybody is talking about gold at well below $1000; I think even below $500 has been mentioned, which means demand has to disappear, as all mines will close. It also seems as if every commentator on the markets are warning of a really deep collapse on Wall Street. My concern is when too large a majority believe that a market will do something, it too often does the opposite. That holds a good future for the metals, but a run-away Dow? – in my mind only if the dollar folds.
Euro-Dollar Chart
If the charts are speaking the truth with respect to precious metals, then it can be assumed the euro will also benefit from whatever might set the metals free. It has held resolutely above support from the long term bull channel, XYZ ($1.0801), and then recovered from the recent Greek-inflamed sell-off; enough to briefly break to above steep bear channel VW ($1.0860) and then slide down along it, getting close to the key support at line Z ($1.0810), the bottom of the major bull channel WZ.
The euro situation is still fragile; it did not require a major shift in the market for it to break below the key support at line M to extend the break below the bull channel ABCM $(1.1040). On the other hand, it failed – so far – to properly test the support at line Z before turning a bit higher! It has however broken back above steep bear channel VW and briefly back above line M – which did not hold. The outlook for the euro remains slightly positive, with a sold break back above line M to confirm.
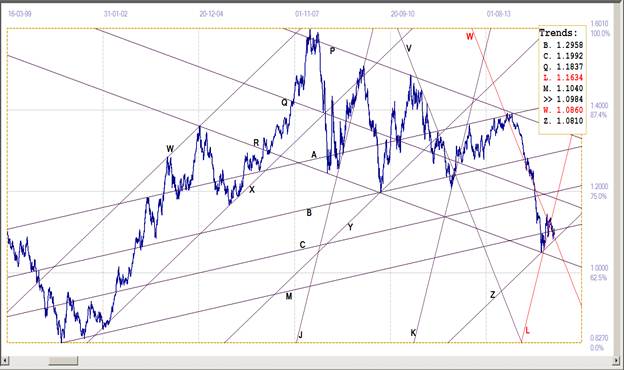
Euro-dollar, last = $1.0984 (www.investing.com)
Dow Jones Industrial Average (DJIA)
After making its double top, the DJIA reversed lower to move away from the rising wedge MZ (19070 to hold within bear channel RS (18045). It has been oscillating in the megaphone SL with support near line L (17308) and it would seem the DJIA has finally topped out – making a start to the gloom and doom scenario so widely being predicted now. A megaphone is an unstable chart formation, that can become very volatile and the price continue to be so even after a break from the pattern.
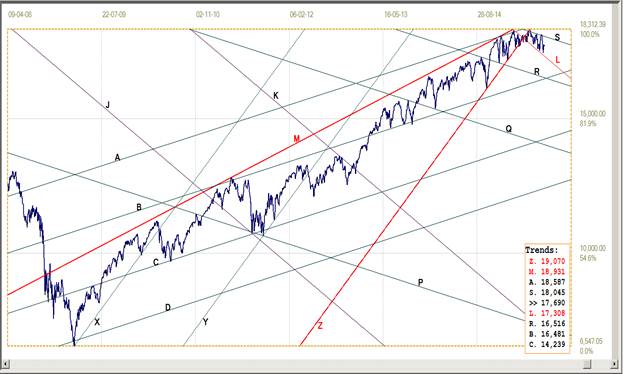
Dow Jones Industrial Index, last = 17690 (money.cnn.com)
Gold PM fix - Dollars
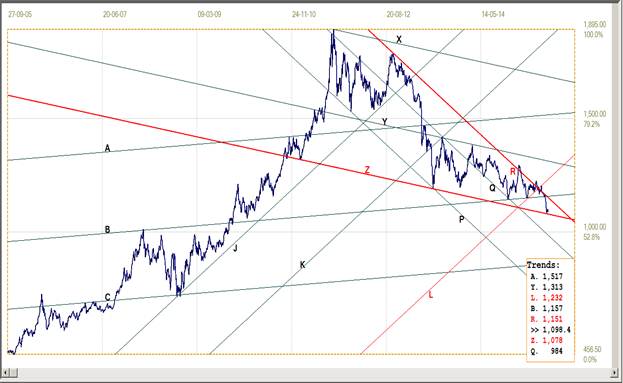
Gold price – London PM fix, last = $1098.40 (www.kitco.com)
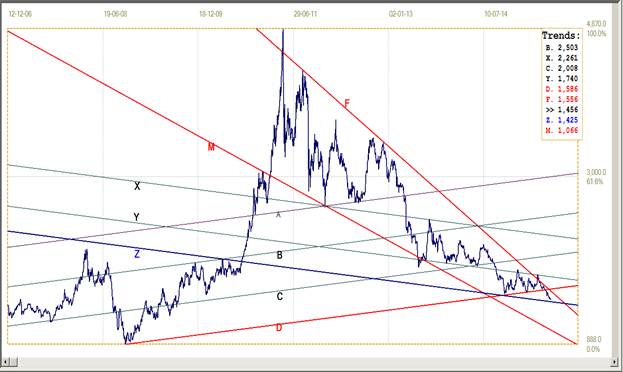
While there gold can still move sideways and lower in the pennant RZ (R: 1151, Z: 1078), the fact that gold has already completed leg 4 within that pattern is reason for optimism – more so since it has held above that support for the past week. Now a recovery back above the major support along line B ($1157) that has held firm on two recent occasions, would first require a break above the pennant – which would also have completed leg 5 of the formation to give a long term bull signal.
Line Z is now key support so that, while it holds, as a sideways move between line Z and line R to remain in the pennant while still on its leg 5, should still be reason for optimism. There is ample room to move sideways, at least until October!
Gold PM fix - Euro
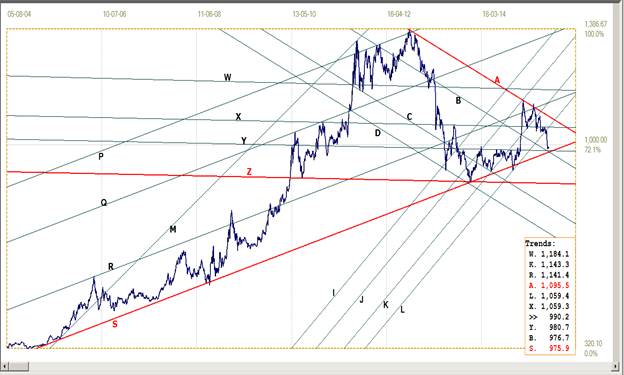
Euro gold price – PM fix in Euro, last = €990.2 (www.kitco.com)
The euro price of gold moved sharply lower when it broke below the stranglehold of the tightly range bound sideways trend just below line X (€1059) – to decline clear below bull channel KL (€1059) in one fell swoop. The decline ended above support at line Y (€980.7) and is holding steady there, just off the bottom of large triangle AS (€975.9).
For quite some time after completing leg 3 of the large triangle at line A (€1095) it seemed as if leg 4 might not extend lower far enough to be completed, until now. It now seems likely that even just a minor move lower could touch line S to complete leg 4, just as the similar leg on the dollar gold chart has been completed. If normal development of the triangle should continue, the new bull market is now in place.
Silver Daily Fix Chart
The picture for silver bears close resemblance to the euro price of gold in that the price is hovering just above the support where leg 4 stands to be completed. The chart shows three major narrowing formations, which are, with their support: the pennant FM ($10.66), the pennant FZ ($14.25) and the triangle FD ($15.86). The pennant FM and triangle FZ have the price on the fourth leg of the chart formation, while the price had broken lower at the end of leg 4 of the triangle FD.
Going back more than 20 years, it has been known that such major chart patterns do not break prematurely – at the end of leg 4 or shortly after – without significant reason. The reason can be a completely unexpected event that catches many major markets unawares, or it can be an external force acting selectively on that market, i.e. some form of manipulation. [This is the subject of a long term research project and observation of such an event back in 1996 was my incentive to begin study of the precious metals market – first gold and then also silver.]
The break below triangle FD happened after a brief spike above line F ($15.56), the kind of event that is explained by a move to a nearby preferred gradient, which in this case happens to be line Y ($17.40). The break lower happened just after leg 4 was completed and from a fraction below line F, which would have completed leg 5.
The bottom of pennant FM, currently at $10.66, is despairing low for silver, which means the support at line Z at $14.25 is a major line of support for silver. So far it is not being challenged, but as always time will tell.
Silver daily fix, last = $14.56 (www.kitco.com)
U.S. 10-year Treasury Note
The yield on the 10-year Treasury note is still in its volatile, mostly sideways trend, reaching down to a recent low at 2.187% on Friday. This resulted in a break below the steep bear channel VW (2.247%). Just as the 18000 level seems considered of a strategic importance for the DJIA, a weaker trend in the yield on the US 10-year Treasury note appears capped at 2.40%. Any bullish move lower that approaches the 2.0% level on the other hand seems to attract an increase in supply that then pushes the yield higher again.
This week should reveal the validity of these comments – will the yield hold below the steep channel VW and perhaps trend even lower, or will an excess supply cause the yield to move higher again, perhaps back into bear channel VW?

U.S. 10-year Treasury note, last = 2.187% (www.investing.com)
West Texas Intermediate crude. Daily close
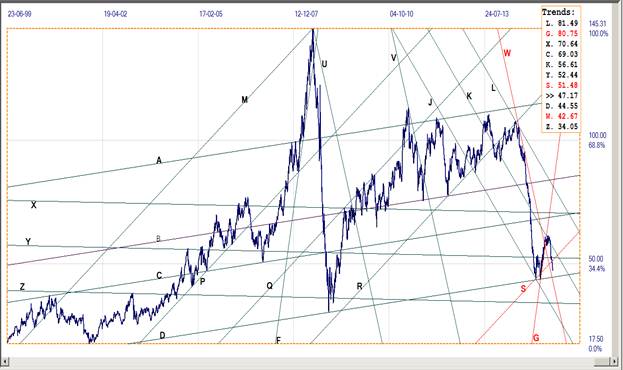
The latest official EIA price is for 27 July. Recovery off support at line D ($44.55) broke below the steep initial support of line G ($80.75) and then fell steeply to also break clear below support at line Y ($52.44) and now also clear below support from bull channel RS ($51.48).
My previous opinion that channel RS is anticipated to be a more gradual path for a recovery in the price of crude has now been shot down. Failure to recover above line S means that the outlook for oil and the oil industry has become more bleak. A full return of Iran to the global oil market may well send the price even lower and it could be that the good support at line D is to be tested again. While positive for low inflation – or smaller increases in the cost of living – a sinking price for crude brings some negative effects in its wake, in particular a slowdown in exploration and a risk of problems in the US fracking industry. The recent reduction in the US reliance on oil imports will be turned around again, but of greater importance is massive debt taken on by exploiters of shale oil at a time when the industry was still profitable, which at current prices is no longer true.
West Texas Intermediate – Daily close, last = $47.17 (27 July)
©2015 daan joubert, Rights Reserved chartsym (at) gmail(dot)com


