Three Factors That Are Changing The Oil Trade


For the last five years, crude oil has been behaving a little differently than it has in the past. At least that’s the takeaway from the chart below, based on the Moore Research Center’s analysis of oil’s seasonal trading patterns. Note that the index on the left measures the greatest historical tendency for the asset to make a seasonal high (100) or low (0) at a given time.
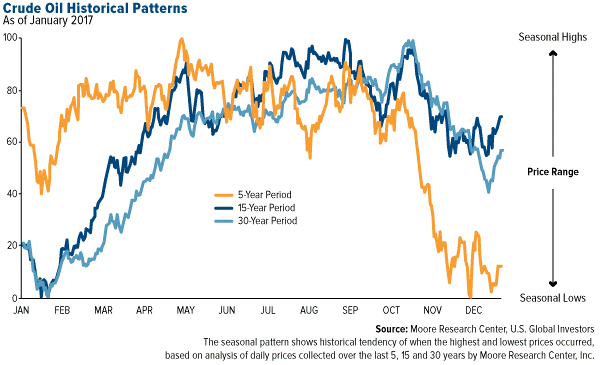
First, take a look at the dark and light blue lines, which represent the average price action for the 15-year period and 30-year period. In either case, oil looks remarkably the same—lows were most likely to have occurred in mid- to late winter, followed by a rally leading into the busy summer travel season. March historically yielded the highest monthly returns, October and November the lowest.
But then something changed. The five-year period, represented by the orange line, shows oil hitting lows not in the winter but in late fall. Highs were more likely in May, not September.
So why’s this happening?
Behold Exhibit A, US Crude Oil Production Since 1983:

American Fracking Responsible For Record Output
Frankly, a lot has changed in the five-year period compared to the longer-term periods. We can put hydraulic fracturing, or fracking, at the top of the list, as it’s responsible for the huge ramp-up in production you see in the chart above.
Fracking has been among the most disruptive technological applications in the history of U.S. energy production. In 2009, oil producers were averaging a little over 5,300 barrels a day. Just six years later, they were well on their way to 10 million barrels a day before an oversupplied market kneecapped prices, prompting producers to shut down operations and abandon oilfields.
 Now, with the number of active rigs in North America on the rise—for the week ended May 5, the number crossed above 700 for the first time in two years—production is beginning to mount once again. According to the Energy Information Administration (EIA), domestic output should average 9.3 million barrels a day this year and nearly 10 million in 2018, a level we haven’t seen in this country since 1970.
Obviously this has a huge effect on the price of oil, which is reflected in the five-year trading pattern. Look again at the orange line. The dramatic plunge you see in October and November coincides with the same period in 2014 when the oil price fell by half.
As influential as fracking is, though, there are a couple other shifting factors at play, including the weather and OPEC policy.
A Growing Number Of Weather Events Costing $1 Billion
Weather undeniably affects production, from droughts to floods to hurricanes. The Canadian wildfires in the summer of 2016, for example, cost oil sands producers an estimated $1.4 billion and knocked out as much as 800,000 barrels of oil a day.
Such extreme weather events are on the rise, according to most experts. The National Centers for Environmental Information (NOAA) reports that in the first quarter of 2017, there were five unusual weather incidents in the U.S. with losses exceeding $1 billion each. That might not sound like a lot—until you learn that between 1980 and 2016, the annual average for similarly large events was 5.5. (In 2016, the total was 15.) We appear to be running ahead of schedule, then, which could have the effect of disrupting some projects.
OPEC Strategy Is Less Effective
There was a time when the Organization of Petroleum Exporting Countries (OPEC) commanded great influence over global oil prices. Responsible for about 40 percent of the world’s production, OPEC can modulate the flow of the black stuff like a spigot with the intent to raise or lower prices.
It’s a strategy that’s reliably worked in the past. In December I showed what happened in the weeks and months following its agreement to cut production in 1998, 2001 and 2008. The data show that prices rallied in the two years after such a pact.
But with American frackers increasingly dominating the global market, OPEC’s decision to trim output is becoming less and less effective.
Take a look:

Since the cartel announced on November 30 that it would reduce production by 1.2 million barrels a day, or about 1 percent of global output, prices climbed to as high as $54 a barrel. Now, however, they look ready to return where they started.
Don’t get me wrong—OPEC still exerts vast control. Oil’s poised to have its best week since late March on news that the cartel and Russia are both planning to extend production cuts into next year, with Saudi Arabia saying it’s prepared to do “whatever it takes” to draw down inventories.
But it’s important to recognize that, in a world where fracking now accounts for more than half of American output, such a strategy is less effective. It will be interesting to see what OPEC decides at its meeting later this month.
Americans Ready To Hit The Road
In its short-term energy outlook, the EIA expects record U.S. highway travel and fuel consumption this summer, which is constructive for energy stocks. Americans are projected to travel 1.4 percent more than last summer and consume 9.5 million barrels of gas per day, 20,000 more than the same period last year.
This bodes well for the types of companies held in our Global Resources Fund (PSPFX), which invests in firms involved not only in the exploration, production and processing of petroleum, natural gas, coal and other, but also basic materials such as chemicals and paper and forest products.
********
Please consider carefully a fund’s investment objectives, risks, charges and expenses. For this and other important information, obtain a fund prospectus by visiting www.usfunds.com or by calling 1-800-US-FUNDS (1-800-873-8637). Read it carefully before investing. Foreside Fund Services, LLC, Distributor. U.S. Global Investors is the investment adviser.
Foreign and emerging market investing involves special risks such as currency fluctuation and less public disclosure, as well as economic and political risk. Because the Global Resources Fund concentrates its investments in specific industries, the fund may be subject to greater risks and fluctuations than a portfolio representing a broader range of industries.
All opinions expressed and data provided are subject to change without notice. Some of these opinions may not be appropriate to every investor. By clicking the link(s) above, you will be directed to a third-party website(s). U.S. Global Investors does not endorse all information supplied by this/these website(s) and is not responsible for its/their content.
 Frank Holmes is the CEO and Chief Investment Officer of U.S. Global Investors. Mr. Holmes purchased a controlling interest in U.S. Global Investors in 1989 and became the firm’s chief investment officer in 1999. Under his guidance, the company’s funds have received numerous awards and honors including more than two dozen Lipper Fund Awards and certificates. In 2006, Mr. Holmes was selected mining fund manager of the year by the Mining Journal. He is also the co-author of “The Goldwatcher: Demystifying Gold Investing.” Mr. Holmes is engaged in a number of international philanthropies. He is a member of the President’s Circle and on the investment committee of the International Crisis Group, which works to resolve conflict around the world. He is also an advisor to the William J. Clinton Foundation on sustainable development in countries with resource-based economies. Mr. Holmes is a native of Toronto and is a graduate of the University of Western Ontario with a bachelor’s degree in economics. He is a former president and chairman of the Toronto Society of the Investment Dealers Association. Mr. Holmes is a much-sought-after keynote speaker at national and international investment conferences. He is also a regular commentator on the financial television networks CNBC, Bloomberg and Fox Business, and has been profiled by Fortune, Barron’s, The Financial Times and other publications. Visit the U.S. Global Investors website at http://www.usfunds.com. You can contact Frank at: [email protected].


