US Currency in Circulation & the Price of Gold & Silver


This is the first of at three part series on the growth in US Currency in Circulation (CinC)for people interested in investing in gold, silver and mining stocks. There is certainly no better subject than the expansion in CinC since the early 20th Century to illustrate just how underpriced precious metal investments currently are, and their potential for real appreciation in inflation adjusted terms one hundred years later. Except where noted, 99% of my data is from the statistical pages of old issues of Barron's, which I personally entered into a spreadsheet.
Every now and then, I produce a graphic that seems to resonate with my readers, like my Gold Priced in 1975 dollars and its CinC deflator from my 04 March 2011 article last week. I received numerous requests for the same chart, but using silver and CinC. Come to think of it, I'd like to see it too. But first, here's the gold chart that caught everyone's attention.

Currency in Circulation consists of paper dollars and base metal coins circulating in the economy. The Red Plot (right scale) is CinC in billions of dollars. In the last 36 years, paper money and base metal coinage have increased 1000%. This is a horrendous rate of inflation. If left unchecked, monetary inflation will continue to destroy the American dollar as an economic unit of account. In other words, with the likes of Doctor Bernanke at the helm of the Federal Reserve, it's highly doubtful that the US dollar, AND the world as we know it, will last another 36 years. Contemporary Keynesian Economists refuse to even examine the historical aspect of monetary inflation, so we have to go to cultural historians to see monetary inflation's ultimate effects:
"Such were the sources of that flood of paper money which, ever since, has alternatively accelerated and threatened the economic life of the world." -William Durant: Our Oriental Heritage, (1935) pg 780
The key phrase is: "alternatively accelerated and threatened"
Durant was examining the World's first experiment with paper money in China a thousand years ago. As with any dangerous narcotic, monetary inflation is at first wonderfully stimulative, but ultimately the unchecked expansion in the money supply always proves to be a highly addictive drug; a pernicious habit the issuing government cannot kick until disaster overwhelms their society. Somehow, the following historical fact is never mentioned in Economics 101.
"There is no means of avoiding a final collapse of a boom brought about by credit expansion. The alternative is only whether the crisis should come sooner as a result of a voluntary abandonment of further credit expansion or later as a final and total catastrophe of the currency system involved." -- Ludwig von Mises
Back to my chart above, whoseBlue Plot (left scale) is the price of gold deflated by CinC. I "deflated" the price of gold by:
- Indexing CinC to 1.00 for 06 January 1975. I did this by dividing each weekly value ofCinC for the 36 years seen in the chart, by the first value in the series ($79.65 billion) published in Barron's 06 January 1975 issue.
- Dividing the price of gold by the indexed value of CinC from 1975 to 2011.
This makes the gold plot above a horse race between the price of gold, and monetary inflation as measured by CinC (red plot). And note how the Federal Reserve's horseneveronce slows down or runs backwards!
The top of the 1970s gold bull market saw gold'sweekly closing price at $822.00 in Barron's 21 January 1980 issue. But in the blue plot above, gold priced in 1975 dollars was only $530. This is because gold'sCinC deflator had increased from 1.00 in January 1975, to 1.55 in January 1980. So, even taking into account the 55% increase in the number of dollars in circulation, gold's 5 year increase in 1975 dollars (Jan 1975- Jan 80) had risen to $530, from its January 1975 price of $174 published in Barron's. This means that gold not only protected the wealth of those who held it from the ravages of consumer price inflation, it also provided $530 - $174 = $356 real profit in 1975-inflation adjusted dollars!
Well, so what? After all, didn't gold go up in terms of both 1975 & 1980s dollars? Ya-sure, you-betcha. But the world wasn't created in January 1975. The price action in gold and silver from 1975-80 were the final scene of a monetary disaster that began in the early 1950s when the US Government broke faith with the worldby printing more paper dollars than it had gold in the US Treasury backing them. If Washington REALLY believed that honesty is the best policy, then CinCsince World War 2 would not have expanded 34 times, and gold priced in US dollars would still be $35 an ounce.
The great lesson we learn from history is that peoplelearn nothing from history. But I still have hope that SOME individuals can learn from the past, so I occasionally list the following articles or editorial comments from the dusty, and now mostly forgotten pages of Barron's on Banking and the US dollar.
We see in the last article on the US dollar (US$), that the consequences of expanding credit in 1952, and "nothing down" credit in 1955 were not immediate, but still inescapable in the fullness of time. The poor decisions made at the highest levels of government and finance in the post-war years, eventually resulted in a dollar crisis and bull market in gold and silver from 1968 to 1980. The same is true with our current gold and silver bull market, where inflation drives the price of gold and silver higher, BUT ONLY AFTER A PROLONGED PERIOD OF MONETARY ABUSES BRINGS ON A CRISIS IN THE DEBT MARKETS AND THE US DOLLAR ITSELF.
Largely unknown to contemporary market commentators and investors, is the fact that massive monetary inflation more often * REDUCES * the purchasing power of gold and silver than increases it. In the chart above we see this happening from 1980 to 2001. So seeing gold and silver rise up and down in price is not just about making money in the market. These long term trends in the prices of gold and silver provides a unique insight into the * economy's reaction, * to the pleasure and pain experienced by the economy from the daily "injections" of "liquidity" from the Federal Reserve.
Currently, the rising price of gold from 2001 to 2011 is informing us that US "monetary policy" has once again driven the global currency markets into a crisis.
William Durant's historical research tells us that we, as a society, are profoundly addicted to cheap credit and monthly checks from the government. The near riot conditions now seen in the Wisconsin State Capital building is but a taste of what is to come. Society will continue to demand its daily injection of "liquidity" from Doctor Bernanke to prevent the credit markets from going into another crisis, until the US dollar can no longer function as money.
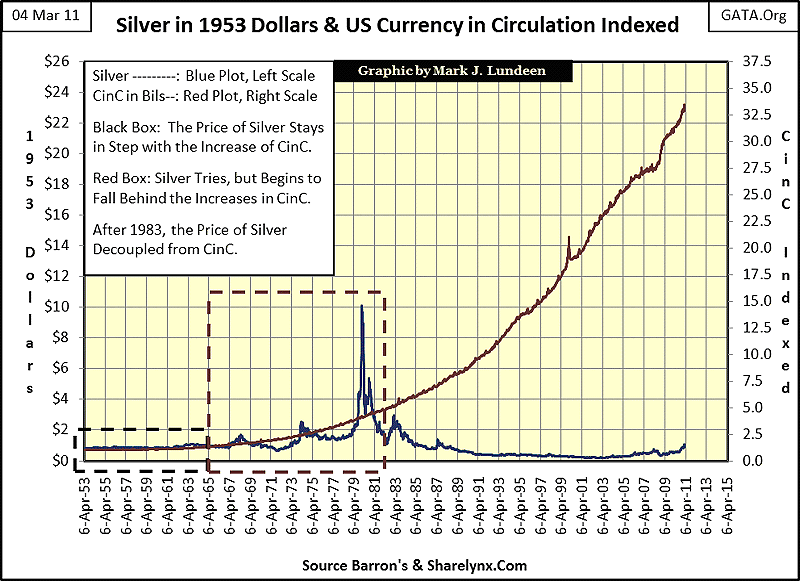
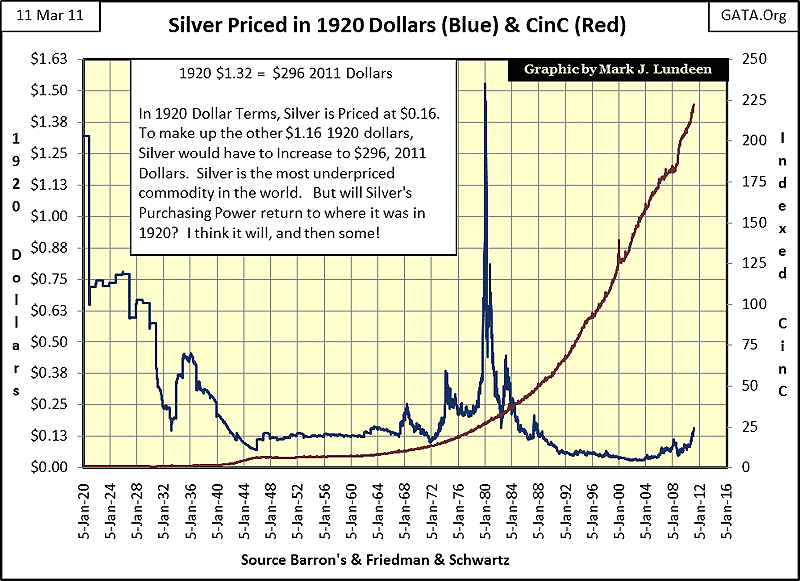
Next we look at silver deflated with 1953 dollars, plotted with its indexed CinC deflator going back to 1953. Plotting CinC's index shows us how many times the US Government has increased Currency in Circulation from its published value of $29.75 billion in Barron's 06 April 1953 issue: 33.51 times. Again, note silver's reaction to decades of massive inflation. It's more inclined to go down than up, until there is a crisis in the US dollar.
Monetary inflation flowing from the Federal Reserve, or any other central bankis a tax on the economy that flows directly into the coffers of the government AND its banking system. Since 1953, the US "monetary authorities" have inflicted horrible losses on holders of US Currency, and fixed income investors with their continual expansion of currency and credit. Purchasing a high grade bond yielding 3% in 1953 and holding it to term in 1972 was a losing proposition, as bond holders were left with little after 20 year of inflationary losses on their principal and income.
Below is a plot of the price and yield for the Dow Jones 10-Utility Bond Average. Dow Jones discontinued this bond series in 2002, but the data provides an excellent record of the disaster bond holders experienced from the late 1940s to 1981. There is no safer bond than a high quality utility bond, but NObond is a safe investment when a government inflates its money supply as a matter of "policy." So starting in the early 1950s, the bond market began demanding an inflation premium that eventually took AAA utility bond yields (Red Plot) up to a yield of 16% in 1981,resulting in a loss in value of 45% for bondholders.
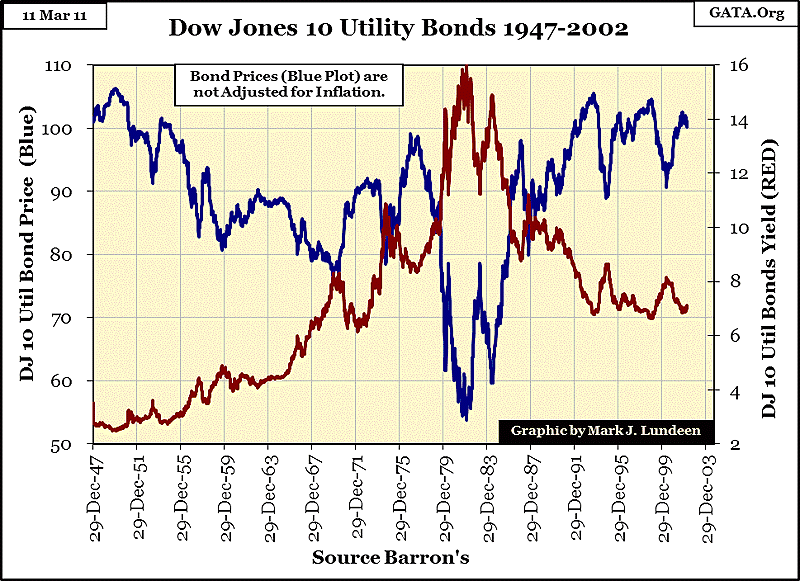
But using nominal dollar values fails toadequately describe the actual inflationary losses bond holders took on their principal and interest payments from 1947-81. Look at US Postage rates; a first class stamp cost $0.03 in 1952. But when bond yields peaked in October 1981, first class postage had increased to $0.18. This was a 500% increase in postage rates. It's safe to assume that * all * living expenses increased at least a few hundred percent from 1952-81. So, a retired couple in 1952 who were living off the income from $40,000 invested in 3% utility bonds received a yearly income of $1200. They weren't wealthy, but looking at prices from old newspapers of that era, an income of $100 a month provided a comfortable living for them. But monetary inflation from the Federal Reserve, a legislative creation of the US Congress, changed all that by October 1981, by transferring the purchasing power of the retired couple's $40,000 bond portfolio, to the US Treasury and the Federal Reserve System via monetary inflation.
But the Fed has been inflating the US money supply since 1913. As my CinC, and gold and silver price data only goes back to January 1920, let's take a look at the effects of this expansion in currency's effects on the price of gold and silver using constant 1920 dollars; first gold:
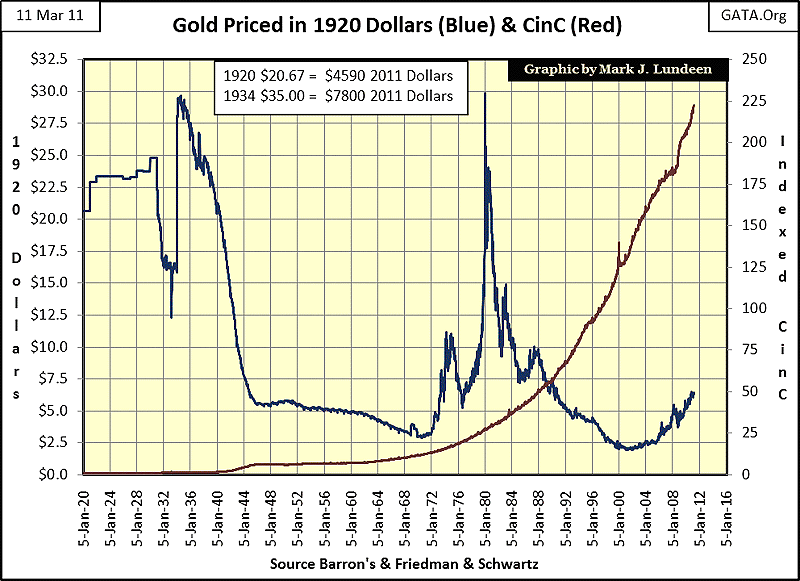
We are looking at 91 years of CinC history. During these nine decades the price of gold in constant 1920 dollars has only seen three periods where the price of gold reacted positively to this massive inflation.
- 1920-30 (10 years)
- 1970-80 (10 years)
- 2000-11 (11 years)
So for 60 of these 91 years, the Purchasing Power Gold Represented only went * DOWN * in the face of the Massive Inflationary Flows from the Federal Reserve. This may be hard to believe, but it's a fact documented in the data published weekly in Barron's! My POINT is that "printing money", or global wars, or social unrest in the Mideast oil producing nations, or even near riot conditions in the Wisconsin state capital doesn't cause the price of gold go up. What makes the price of gold go up is when:
- the "policy makers" have Printed * too*much money - FOR TOO LONG A TIME,
- the "policy makers" have Expanded * too * much credit - FOR TOO LONG A TIME,
- Debt ensnared consumers and business come to realize that there is no way out, and massive default in the money and credit markets become growing concerns. This is why gold and silver bull markets thrive during periods of rising interest rates: wealth flees into gold and silver from the crumbling credit markets.
The Chart above fails to properly illustrate the degree of CinC expansion during World War 2, so I adjusted the scale in the chart below. Frequently, "economic experts" on CNBC will attribute the rising price of gold to war or inflation, BUT THIS IS INCORRECT! Look closely at what happened from 1934 to 1946; the US saw massive monetary inflation, and entered into World War 2 as the World slipped into Chaos with no change in the nominal $35 dollar price of gold. But an ounce of gold's purchasing power, as measured by 1920 constant dollars fell from $30 to $5 dollars! During this time one of two things happened to Americans who owned gold bullion: if the Feds caught them, their gold was confiscated for a 100% loss on their gold investment. If they were successful in keeping their gold horde a secret, monetary inflation gave their gold investment an 83% hair cut by 1946.
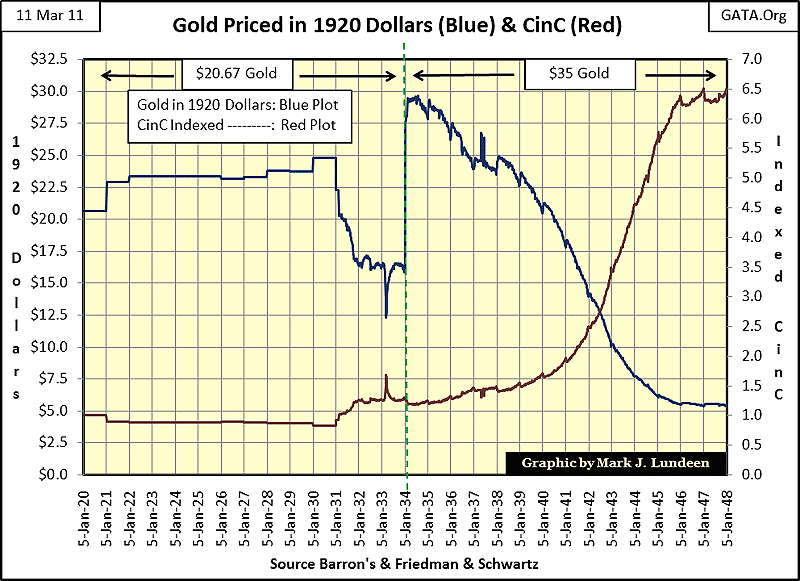
This is because all during this period, the US dollar was seen as an important economic asset that everyone in the world wanted, while gold was not. This continued to be the case until as we see in the 1920-2011 chart above, gold in 1969 began increasing in 1920 dollar terms.
Next is a silver chart priced in 1920 dollars. Silver's peak price of $50 dollars in 1980 has an element of "shock and awe" to it - when charted in nominal dollars. But when priced in constant 1920 dollars, silver only managed to exceed it's 1920 value by a few cents for a few days. If silver is to repeat its amazing 1980's performance, it would now have to increase to $296, 2011 dollars. Will silver do this? If the US Government continues its trillion dollar deficit spending ways, and continues allowing the Federal Reserve to debase the US dollar, I think it will go past $296 and then some! But people should stop thinking of gold and silver in dollar terms; and focus of how many ounces of gold and silver they can exchange for their paper dollars while they still can.
From the CinC data plotted on the 1920 to 1948 gold chart, one might be led to believe that the 1920s were a time of stable "monetary policy," as CinC from 1920-31 actually declined. But the Roaring 20s "roared" for a reason! When a banking system controls the money supply, it can expand the money supply with either currency, credit, or both. The Roaring 20s was a time of reckless increases in bank credit, not CinC expansion. I suspect the reason CinC only began to increase in 1931 was because the banking system, and its clients were upchucking the credit taken on in the 1920s, and so the banking system in the early 1930s, as is the case now, was actually incapable of expanding the money supply using its normal practice of credit expansion. Also, bank runs were becoming a frequent phenomenon, and people closing out their accounts demanded paper money.
The marketing term "buy now - pay later" was first coined by the Singer Sewing Machine Company in the 1920s,using credit provided by the Federal Reserve System. Providing credit directly to the consumer was never attempted by the American banking system until after the creation of the Federal Reserve. The wisdom of this policy is now well understood by all too many deeply indebted "consumers" who took full advantage of the low interest rates offered by their bank, and made possible by the insurance companies and pension funds who now hold the securitized credit card, auto, mortgage, school and US Treasury debt.
Reading the old issues of Barron's, we see where cheap credit from the 1920s era Federal Reserve financed real estate boom/busts. C. W. Barron's (the founder of Barron's Financial Weekly, the source of 99% of my data) personally placed responsibility for devastating the Florida real estate market on the Fed's excessive credit creation. Barron's in the 1920s also observed the removal of gold coins from circulation, and correctly noted this was due to the Fed's monetary excesses.
There is a lot one can learn from those old issues of Barron's, but the best graphic to show the extent of credit creation by the Federal Reserve System during the Roaring 20s, is in the stock market. Here is a chart from an August 2008 article I wrote on NYSE Margin Debt and the Dow Jones during the Roaring 20s and depressing 30s. Note how CinC (green plot) actually went down during the 1920s.
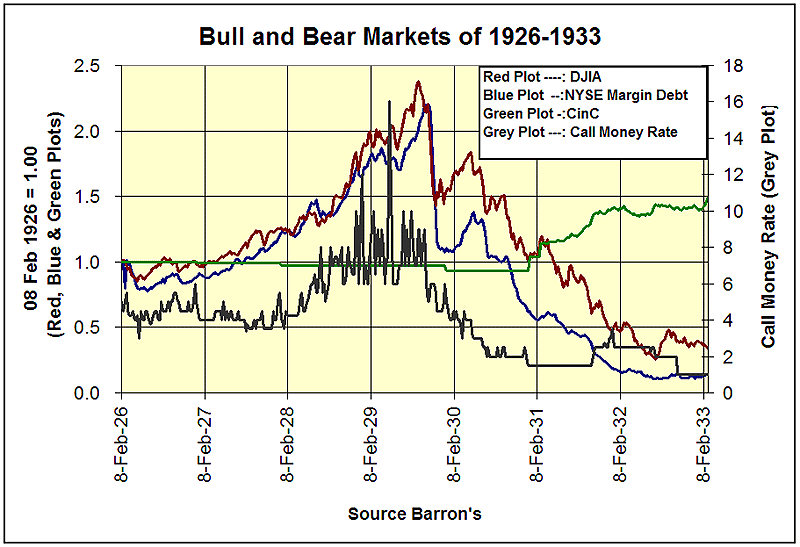
The two key plots to note are the Red-Dow Jones, and the Blue-NYSE Margin Debt plots. Observe how they move up and down in lock step with each other from 1926 to 1932. And again, this data is from the actual issues of Barron's fromthe 1920s and 30s, so we are looking at unaltered market history. Note how the Dow Jones broke down in 1929, even as more credit (margin debt) from the Fed was flowing into the stock market. But after the stock market bubble popped in 1929, even lowering the Call Money Rate for margin debt could not reverse the flow of "liquidity" away from the stock market. During the Great Depression Bear, the Federal Reserve was counting on low margin interest rates to lure retail investors back to the market. But when gold prices start rising; that trick stops working!
Currently I suspect the stock market finds itself in the exact same position it found itself in during the 1930s. If left to its own means, the stock, and bond markets would deflate to levels incomprehensible to investors today. But with today's "regulated markets", this is politically unacceptable. So I believe the main difference between today's and the financial markets of the 1930s,is that the US Congress gave the US Treasury and its lackey, the Federal Reserve secret "NEW TOOLS" to combat "DEFLATION" back in October 2008.
I believe that the "policy makers" efforts to draw retail investors back into the stock market since the October 2007 top have been no more successful than were their efforts in 1930. So in the fullness of time, I believe we will all discover that the "new tools" granted to the Treasury and Fed, were most likely a simple agreement between our elected and unelected "policy makers," that the Fed and US Treasury would support the financial markets by funneling "liquidity" to the "Favored-Unnamed Financial Institutions." This could be done using accounts in the Caribbean banking system, with no questions asked by the Justice Department or the Internal Revenue Service. As seen in the link provided above, the small islands that make up the Caribbean Banking Center currently hold the 6th largest position in US Treasury debt. And unlike Switzerland, Uncle Sam isn't putting public pressure on these banks to learn who owns these bonds.
These massive positions in toxic mortgage paper and US Treasury bonds (and I suspect shares listed on the NYSE and NASDAQ), currently owned by the Federal Reserve and its banking system will one day have to be liquidated, and losses accounted for. We may find that eventually, the largest banks own a controlling interest in themselves, (or each other), and will want to delist and go private. Liquidation of companies that they don't want to control will occur near rock bottom in the bear market with the Dow Jones at levels not seen since the Great Depression. If the stock market survives, the liquidation of the banking system's clandestine stock portfolio would produce a low-risk, rock-hard bottom these deflationary bear markets always seem to produce, and once again gold and silver would become marginal investments. But on the way down, as bond yields soar past the double digit returns of the early 1980s, investors will want to be invested in precious metals.
This week I looked at CinC and the price of gold and silver. Next week in part 2 of this series, we'll look at CinC and the US Gold Reserves from 1925 to 2011.![]()
Mark J. Lundeen
12 March 2011


