The US Dollar And The Gold Price


The first chart I would like to show you tonight is the long term monthly chart for the US Dollar I showed you a week or two ago. It was coming into contact with the top rail of a massive 30 year falling wedge at 93.50. I also drew in a neckline extension rail taken from the H&S top that formed back in 2000 which came in at 92. I put the little brown box to show you where I was hoping to find support. So far the top rail is doing its thing by reversing its role to what had been resistance to now support once it was broken to the upside. This is a critical test taking place right here which so far the US dollar bulls are winning.

The next chart for the US Dollar is the old fractal chart which shows you the breakout from the massive base last year and the impulse move that followed. After a big move like that a stock needs to consolidate for a period of time to work off the overbought condition. If the initial low is in, as shown by the chart above, then we should have at least a top and bottom for the next consolidation pattern to trade between as shown by the two red horizontal trendlines. There is no way to know what type of consolidation pattern the dollar may build out but this is a perfect place for some type of consolidation pattern develop. This means we should now see a rally up toward the old high and at least one more decline after that to get our minimum of four reversal points. Just playing with the potential red trading range, if I measure from the breakout point of the massive base #2 to the recent high and take that measurement and add it to the breakout point of the top red rail, it would give us a price objective back up to the 2000 high around the 120 area. This is just speculation on my part because we don’t know if the top red rail will be a horizontal trendline giving us a rectangle or if it will slope down a bit giving us a triangle. Either way if this area proves out to be a consolidation zone the old high in 2000 at 120 should come back into play.

Below is a combo chart that has gold on top and the US dollar on the bottom. If the dollar is going to consolidate this recent rally phase how will that affect the price of gold? As you can see gold is basically trading closer to the lower end of its support line while the dollar has some room to run to the upside before it reaches to the top red rail of its new trading range. Will the dollar rally force gold below its support line? It will be interesting to see how this plays out over the coming weeks and months. This chart below gave me my first good clue that the US dollar’s bear market was coming to an end. You can see the big divergence that occurred in 2011, vertical dashed purple line, to the dollar bottom in 2008 which was much higher. Gold started its near parabolic rise in 2008 when the US dollar was making its bear market low. Gold finally topped out in September 2011 with the US dollar making a higher low vs the 2008 low. That was a huge divergence, purple arrows.

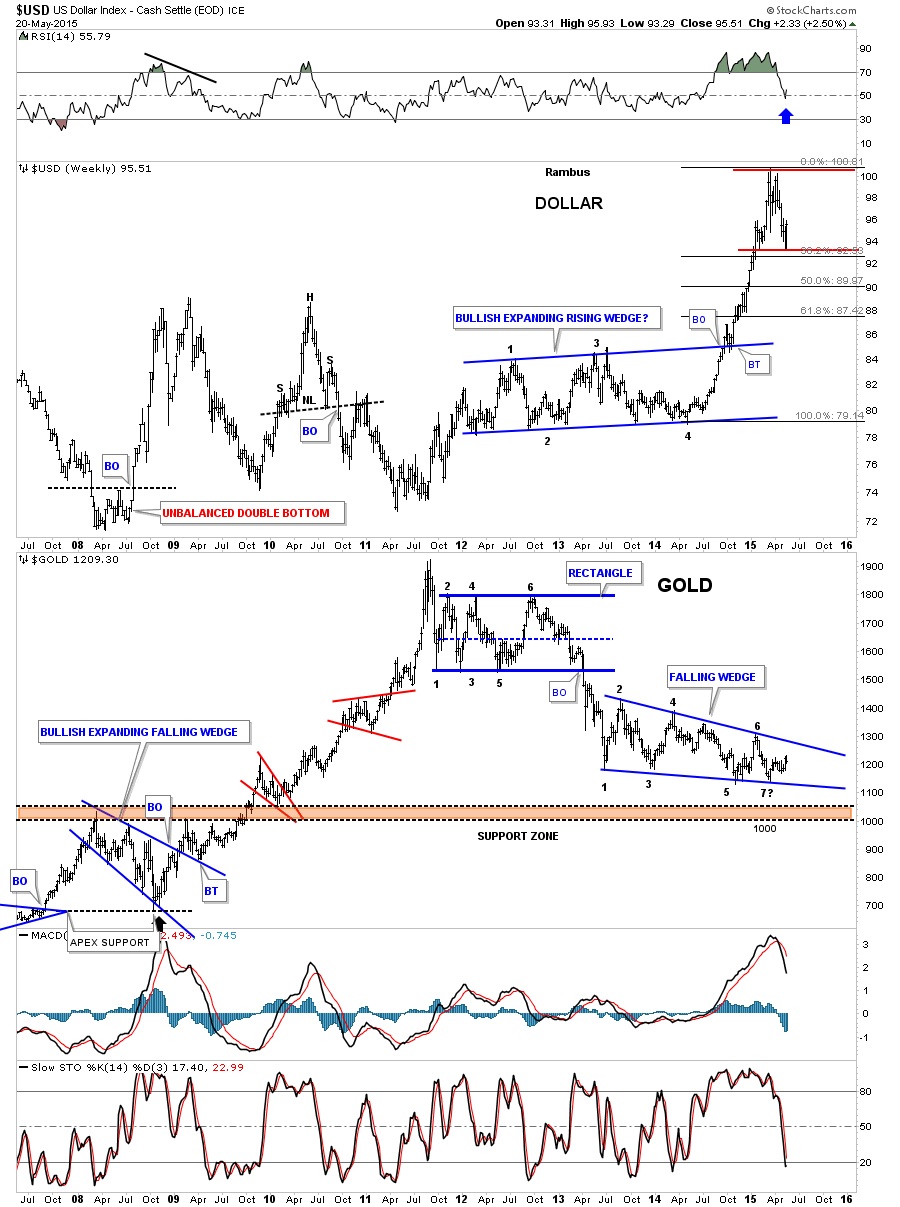
Below is a weekly combo chart for the US dollar and gold that shows the US dollar almost retraced 38% of its breakout rally. Gold shows you why this correction has been so painful as it’s now trying to put in its 7th reversal point to the upside which is just wearing everyone down, bulls and bears alike. As you can see gold is trading right in the center of it’s falling wedge, in the middle of no man’s land.
I know some of you are wondering if the stock markets can rally with the US dollar rallying also. Below is another combo chart that has the US dollar on top and the SPX on the bottom. This combo chart shows the price action from the 1995 to the 2000 secular bull market top for both the dollar and the SPX. So the answer to that question is yes.

Now I would like to show you a daily chart for the XEU that has been in counter trend rally mode since the March low as the US dollar has been correcting. This chart shows that the XEU has been carving out a bearish expanding rising wedge which it just started its fourth reversal point down. If the XEU is topping then the US dollar is bottoming which I showed you on the charts above. This is a big deal as it will most likely have a negative impact on commodities in general.

 Meet Rambus, a seasoned trader and technical analyst renowned for his unbiased and insightful chart work. Through his website, Rambus Chartology, and Substack newsletter, Rambus shares his expertise with a global community of subscribers, providing daily updates, commentaries, and hands-on training in the art and science of chartology. With his calm, humble, and down-to-earth approach, Rambus demystifies complex market trends, helping his followers navigate the challenges of today's volatile markets. Join the Rambus Chartology community today and discover a unique blend of technical analysis, trading expertise, and time-tested protocols. Subscribe now at www.rambus1.com or https://rambuschartology.substack.com/


