US Mint Sales Of Gold Coins Fall In October After 234% Surge In Q3


Total sales of U.S. Mint gold coins came in at 44,500 oz per 94,500 coins sold – including both Eagles and Buffalos. This marked a significant decline in sales y/y, with volume by weight down 49.7% y/y and the number of units sold down 33.7%. Average weight of coin sold was down 24.2% y/y to 0.4709 oz per coin.

Total Sales of US Mint Coins since 2006
As chart above indicates, October fall-off in demand came after the end of 3Q that saw total volume of coding gold sold by the U.S. Mint rising incredible 234% y/y (compared to 3Q 2014) by weight and 305% y/y in terms of number of units sold.
At a total of 471,000 oz sold over 934,500 units in 3Q 2015, last quarter was the best one since 2Q 2010 in terms of volume by weight sales and the best in history of the series (from 1Q 2006) in terms of number of coins sold.
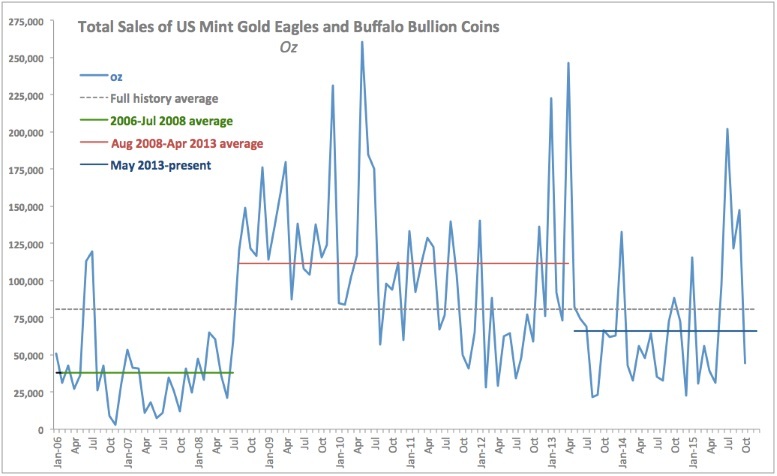
Total Sales of US Mint Gold Eagles and Buffalo Bullion Coins since 2006
Not surprisingly, scale fall off in demand in October can be explained by the moderation in demand back to cyclical normal. As shown in the chart above, overall October sales figures came in below the period average for May 2013 through present. However, stripping out three main outlier peaks in demand, the average comes to 49,978 oz – closer to the October reading of 44,500 oz. In historical comparatives, demand for gold coins in October was 38th lowest by total weight and 56th lowest by coins counts for any month from January 2006 through present.
Another point worth making is seasonality. Over 2006-present horizon, October saw significant decline in demand for gold coins in seven out of 10 years, with insignificant changes m/m recorded in one month. In other words, October tends to be a more bearish month of U.S. Mint coins sales.
Final point worth making is that correlation between demand for U.S. Mint coins (by total oz weight) continued to show negative 12 months correlation with gold price. In October, this correlation stood at -0.58, slightly less in absolute value than in September (-0.59) and below -0.72 correlation in October 2014. Overall, negative correlation remained in every month from April 2014 on, suggesting stable demand interest from investors on foot of gold price declines.
Read the excellent research on US Mint gold coin sales in October by Dr Constantin Gurdgiev.
Editor’s Note: As was seen in the World Gold Council’s Gold Demand Trends Q3 2015 last week, low gold prices in the third quarter saw bargain hunters globally and particularly the U.S. accumulate far more gold bullion coins and bars than they did in any other quarter over the past five years.
According to the report released last Thursday, global gold demand rose 8 percent on-year to 1,121 tons in the third quarter, with the U.S. seeing a new surge in demand.
“There were significant gains in bar and coin demand in China and across Europe, but it was in the U.S. where we saw the most dramatic growth, with U.S. Mint Eagle sales reaching their highest level since the second quarter of 2010,” Alistair Hewitt, Head of market intelligence at the World Gold Council, told media.
Thus, the decline in U.S. Mint sales of gold coins in October was a natural consequence of a decline in the near record demand seen in Q3 and reflects the normal ebb and flow of demand for gold coins and bars.
Last week gold price fell to 5 year lows and weakness again saw canny buyers accumulate on the dip. Sales of U.S. Mint gold coins jumped the most in nearly three months. The 2015 $10 American Gold Eagles actually sold out.


