US Stock Market Breaks Long-Term Uptrend


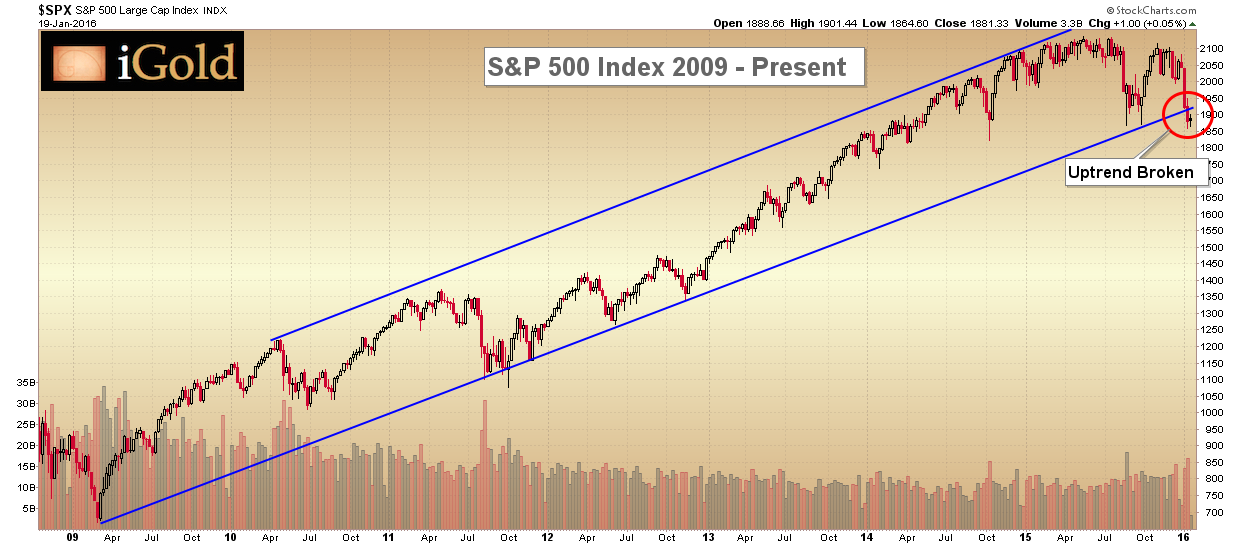
 The US stock market, having risen relentlessly since the crash of 2008, has for the first time in seven years closed on a weekly basis below its major rising trend channel. The significance of such a technical breakdown cannot be understated: broken multi-year trends signify exactly that -- change in a market direction. In this case, the transition we are witnessing is from a bull market to a topping pattern. After a topping pattern, bear markets follow.
The Crash of 2008 for Perspective
Let us compare the current situation in the US stock market to the topping pattern observed in 2007, prior to the crash of 2008.
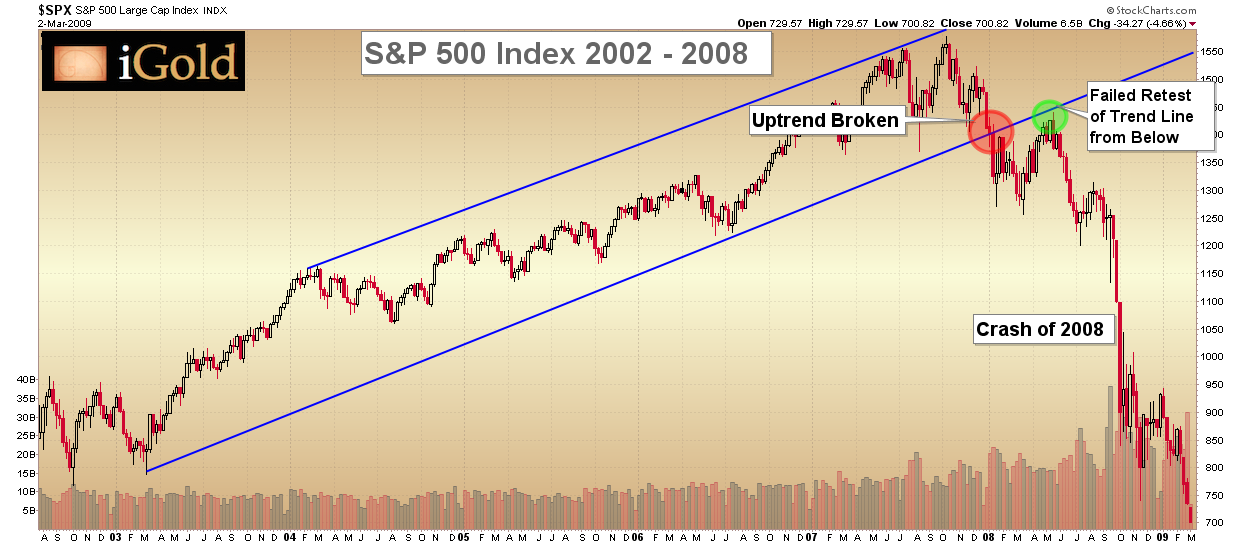
In analyzing the 2002 to 2008 market, we note the following major points:
- A clearly defined multi-year rising trend, perfectly contained by two rising parallel trend lines shown in blue. While the trend line was penetrated briefly one time in September 2011, the market quickly rebounded and never registered a weekly close below this level.
- A broad 18-month topping pattern.
- A break of the lower trend line on a weekly close basis.
- Continued weakness, followed by a rebound several months later which hit the broken trend line, but this time from the downside.
- After the failed retest, a continued decline.
- The crash.
Back to the Present
Where does this put the US stock market currently? To continue with the 2002 to 2008 comparison, we find ourselves at point (3) above. Note that this does not mean that the stock market is facing an imminent crash; rather, it means that we are observing a major trend change. Moderate continued weakness should follow, followed by a rebound over the next 6-9 months. If this trend change signal is to remain valid, any rebounds will fail to close above the broken trend line in a significant manner.
Real World Observations
Whether or not a crash ever materializes, it is important to consider the ramifications of this trend change. For example, let us consider the class of investors who started to enter the market after 2008. College or professional school graduates who entered the workforce after 2008 and then found themselves with disposable income for the first time in their lives know only that the stock market rises, year after year, in a predictable fashion. Their 401(k)'s are surefire ways to consistently grow wealth. That is their financial reality.
Now after seven years of rising, what if the stock market were to stay flat for the subsequent seven years? Or what if the market were to decline for an equal period? This new class of investors will have their entire paradigm shaken. How will they respond?
It will be fascinating to watch. I happen to live in the state with the most college graduates per capita (Massachusetts), and in judging from conversations with a random sampling of recent graduates, there is little to no awareness of the value of precious metals-- either historically or as a viable investment alternative. Gold and silver are generally unknown amongst recent grads with investable capital. At the very least, this represents potential for a significant new wave of buyers to enter the market should the notable trend change we are seeing in the stock market continue to accelerate.
Major Asset Comparison Since the Fed Rate Hike
In a prior article, we made the case that short-term interest-rates have followed generational cycles, and that the current cycle having bottomed at 0% for the last seven years, should be the low from which rising interest rates prevail for the next several decades.
We also showed that throughout history rising short-term interest rates correspond to rising precious metals prices.
Thus, we continue to monitor the progress of several major world asset classes since the historic Fed rate hike on December 16. Clearly there has been a flight to safety as gold, long-term bonds, and silver have been the top-performing assets. US stocks and commodities as a whole continue to struggle.

This is exactly the type of fundamental shift in money flow that is necessary to cause long-term tops and long-term bottoms in respective markets. While we do not expect these trends to continue in such direct linear fashions, we cannot ignore this impulsive shift toward precious metals and away from risk assets in the face of a significant change in interest rate expectations from a generational perspective.
Takeaway on Precious Metals
Precious metals continue to grind toward a final bottom. Gold has had a bounce near our first expected support level in the $1,045 region, and now we wait to see how well this holds. For a review of how we arrived at these targets, please see this link on our final lows targets for the bear market.
It is still too early to definitively call this the final low. Multiple data points, however, are showing that the trends from the last seven years are indeed in the process of changing.
********

Christopher Aaron began his career as an intelligence analyst for the CIA and Department of Defense. He served two tours to Afghanistan and Iraq between 2006 - 2009, conducting pattern-of-life mapping for military leaders.
Mapping shares similarities with technical analysis of the financial markets because both involve the interpretation of repeating patterns found in human nature. He is the founder of iGold Advisor, providing independent research and analytics on all aspects of the precious metals markets.
He speaks regularly on the cyclical patterns found within the financial markets and on international policy. He has been featured in the New York Times and NPR news amongst other financial publications.


