US Stock Market; Weekly Charts


With the help of some of NFTRH‘s standard weekly charts, we take a snapshot of the US stock market.
The Bank index is unbroken from a weekly perspective. People will talk about an H&S but it is not activated until the trend channel and the neckline (a well-defined support area) are broken. BKX, along with the Semiconductors has been a notable leader to the entire surprise* phase of the bull market out of Q4, 2012.
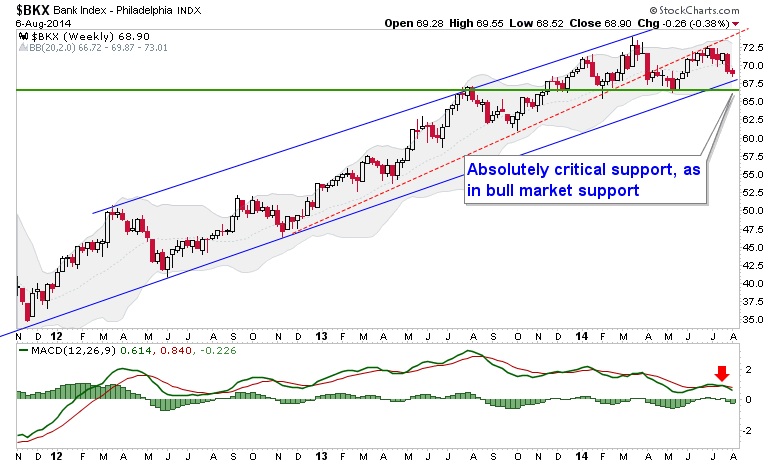
A breakdown of support would break this cycle of the bull market (if this is a secular bull market as many experts think, then the bull would live again after the cycle completes). It would probably be healthiest to the secular bull case for a breakdown to occur into a relatively small cyclical bear market.
An alternative is that this summer correction proves to be the mini variety, serving to refuel for a final and manic launch to new highs (S&P 500 measurement is after all, 2192) that would ironically put a lie to Team Secular Bull after it ultimately flames out.
* Surprised? Well, I came to be surprised (since moderated) by the longevity and intensity of this bull phase but our analysis was among the distinct minority leaning bullish in Q4 2012 due to the unsustainable hype of the Fiscal Cliff drama and the waning hype of the acute phase of the Euro Crisis. Then in Q1 of 2013 came macro fundamental news (provided for NFTRH subscribers in real time) out of the Semiconductor equipment sector, an up-turned Palladium-Gold ratio and down the road improving ISM, ‘jobs’, etc. Surprised? Nah.
The Semiconductor index has dropped to a logical support area but the important – as in for all the marbles for Team Secular Bull – is the big picture breakout point at 560. It cannot be stressed strongly enough how critical that support would be to determining what this bull market is (or was).

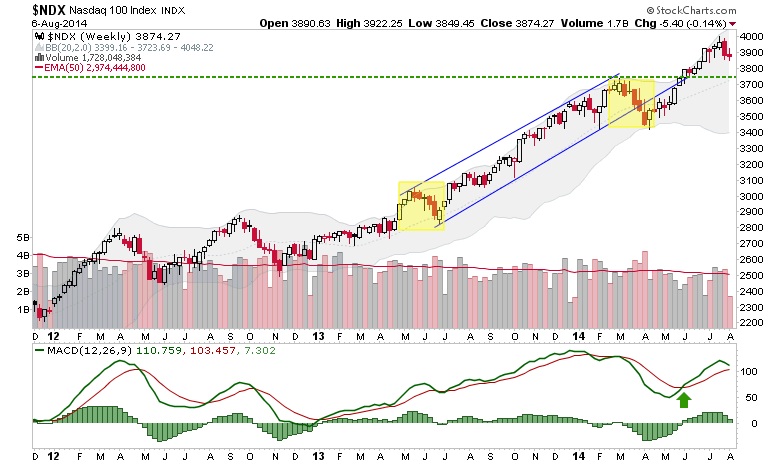
NDX is on a routine drop to test the first support area after yellow shaded correction #2 proved just as bullish as #1.
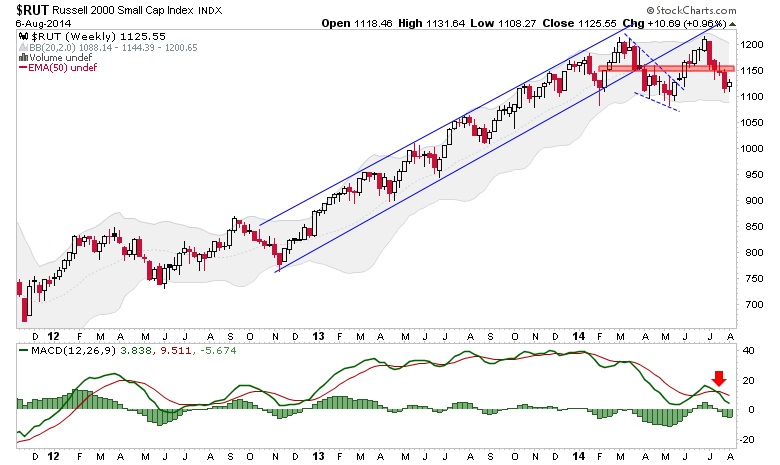
A momentum leader, the Russell 2000 Index continues to look poor with an ugly double top forming. As noted previously, a logical point to take bear positioning is at or around 1150.
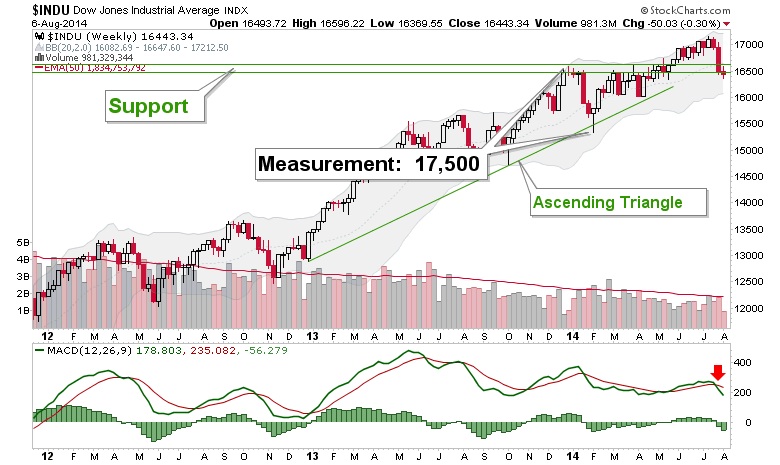
The Dow Index is getting interesting because it is at support critical to its Ascending Triangle and our long-standing operating target of 17500. If it breaks down from here it does not mean 17500 will not be achieved one day, but it does mean that it would not have done it off of this Triangle, which would be neutered before its measurement was achieved.
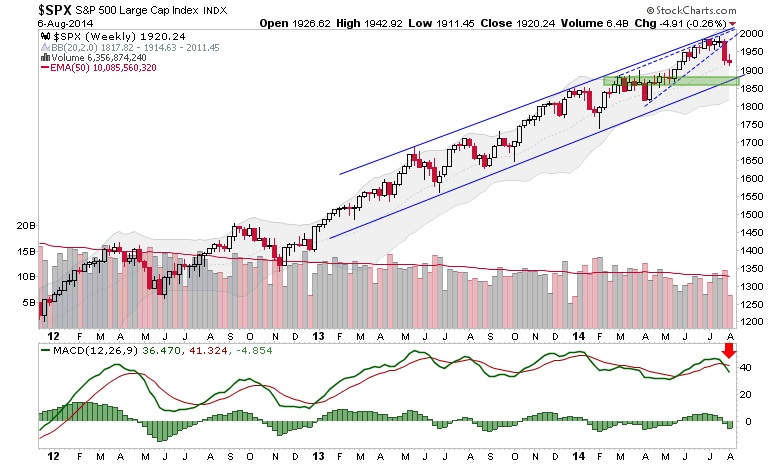
S&P500′s weekly chart matches up well with the daily we reviewed the other day. While SPX has not (yet) bounced to the degree I had hoped in order to re-short, the important support zones of the daily and the weekly match up nicely. A drop below the noted support would break the bull cycle. But a drop to that zone could prove a buying opportunity. Don’t you love the markets? Parameters parameters everywhere, and not a definitive answer among them.
We’ll wrap it up with a look at the post-Q4 2012 leaders, the BKX-SPX and SOX-SPX ratios.

Banks vs. the S&P500 is still wobbly and below resistance. This ratio led the recent decline in the stock market.

SOX-SPX ratio is well within its post-Q4 2012 channel as well as its more pronounced channel out of 2013. In other words, the Semi’s leadership is a-okay.
Bottom Line
We fully anticipated a summer correction and thus far that is all it has been; and it’s been a mild one (so far) at that. But what the markets do from here on out will refine probabilities as to these options…
Option 1: A shallow correction here, could be a prelude to strongly renewed speculative vigor, culminating in a terminal bull market blow off. Ironically, Team Secular Bull would look heroic for a while and yet, this is not the scenario true secular bull adherents would want to see. A healthy market would need a real bearish clean out and even a moderate cyclical bear.
Option 2: The current correction bites deeper, testing the cyclical bull market’s limits but ultimately holds (using SPX 1860′s as a general reference point).
Option 3: Of course, such a test of limits implies a decision point, and if the decision is that support would fail, then the cyclical bull may have already ended as I write this.
That does not invalidate the prospect that we are in a new secular bull market, but personally I find the ‘secular vs. cyclical’ discussion useless because I for one do not ride cyclical bear markets down in anything resembling a ‘stocks for the long run’ brain wash.
You’ll notice I did not make even a passing mention of policy makers and their influence upon markets. That is because TA is TA and macro fundamental bitching and moaning is what it is. The above is the weekly TA picture on US markets, on the straight and narrow.
********
Biiwii.com | Notes From the Rabbit Hole | Free eLetter | Twitter
Subscribe to NFTRH Premium for your 25-35 page weekly report, interim updates (including Key ETF charts) and NFTRH+ chart/trade ideas!


