Wealth Building 101: Gold Stock Ratios


 The price movement of gold and silver bullion continues to disappoint both the bulls and bears. “Key” upside and downside breakouts are followed by more sideways action.
It’s not just gold and silver that are acting like slugs in the mud. Bill Gross has just echoed my view that the US stock market is entering a price area where it will perform much like a wet noodle.
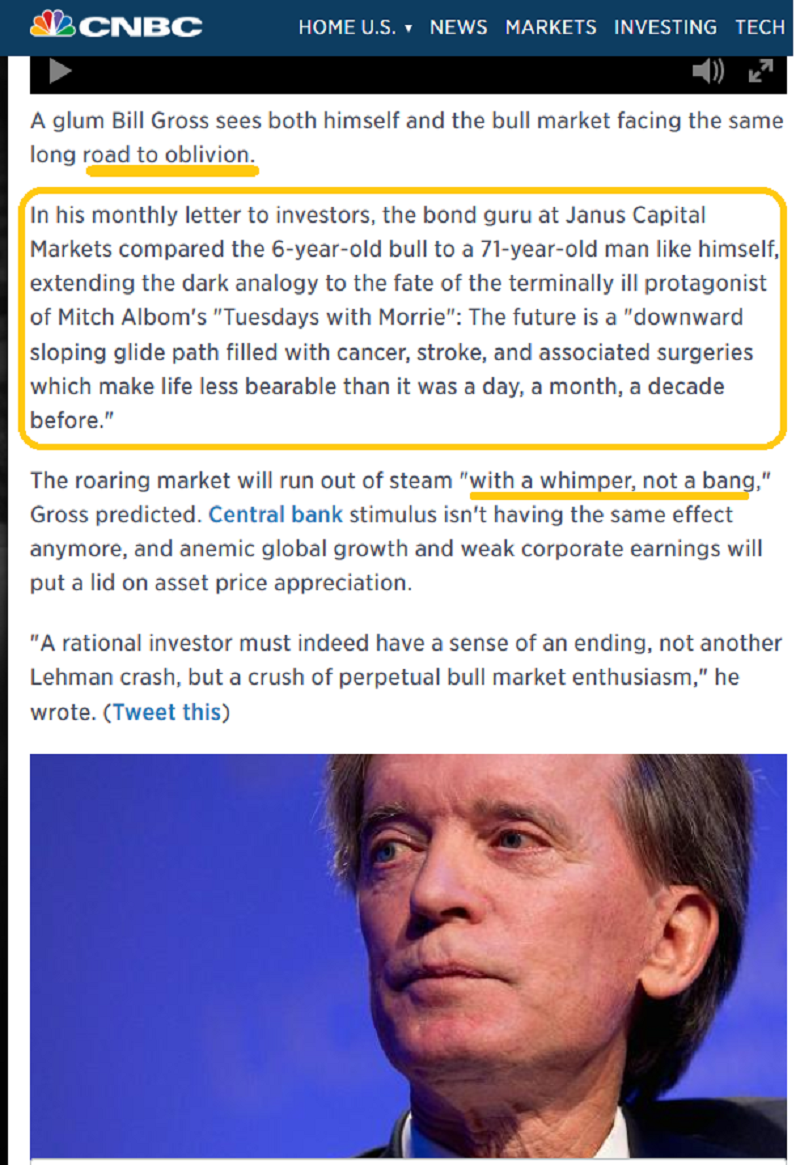
Bill suggests, as I have for more than a year, that rather than surging higher or blowing up in a fireball, the US equity market will simply fade away.
The big action now, is not in the US stock or bond markets, and it’s not in gold and silver bullion. It’s in gold and silver stocks.
The US business upcycle begin in October of 2008. It’s almost 7 years old now. The average upcycle lasts about 8 years, and signs of modest inflation and sluggish growth typically appear at the end of the cycle.
That’s exactly what’s happening now. It’s a generally supportive environment for gold and silver, and an ideal one for gold and silver stocks.
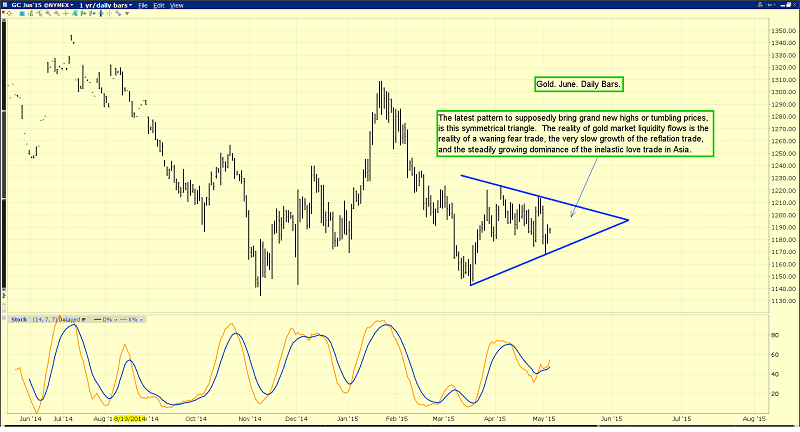
That’s the daily gold chart. The price continues to grind sideways. Gold is clearly ignoring the parabolic catcalls of wild bulls, and frustrating the vociferous bears who promise “final capitulations” and gigantic “new legs down”.

I expect gold bullion will continue to frustrate the bulls and bears for several more years, as will silver. That’s the daily silver chart. Like gold, silver is treading water, and I expect it to continue do so throughout 2016, with a mild upwards bias.
How does an investor make money in a sideways market? The answer is: Short term trading and dividend-oriented investment. When prices are volatile, range trading can be quite profitable, When it isn’t, juicy dividends can bring tremendous satisfaction to any metals-oriented investor. I have a huge focus on dividends in my own investing.
In regards to the US dollar index, many analysts are trying to call a top or a new leg higher, and relate that to a big move in gold prices. I don’t see a top, or a new leg higher. I see a drift sideways in the dollar, a drift in bonds, a drift in bullion, a drift in the Dow, and much higher gold and silver stock prices!
Fresh signs of inflation are imminent, and that will bring the first rate hike. That rate hike is supportive for the dollar and negative for gold, but the inflation itself is supportive for gold. So, sideways price action will be the result, with a very mild upwards bias, because of the growth of the Chindian love trade.

Mainstream media is starting to pick up on the inflation theme.
It’s a relatively tame theme, and I expect it to stay that way, until the banks begin aggressively loaning out the QE “money ball” they are sitting on. They won’t do that unless higher rates come into play, making those loans, at least initially, very profitable.
In 2016, I expect the US government to begin directing monies away from their useless wars in the Mid-East, and towards giant infrastructure projects, and that will add more inflationary pressure. Gold stocks should do well in 2015, and “rock” in 2016, as more mainstream analysts join the reflationary bandwagon.
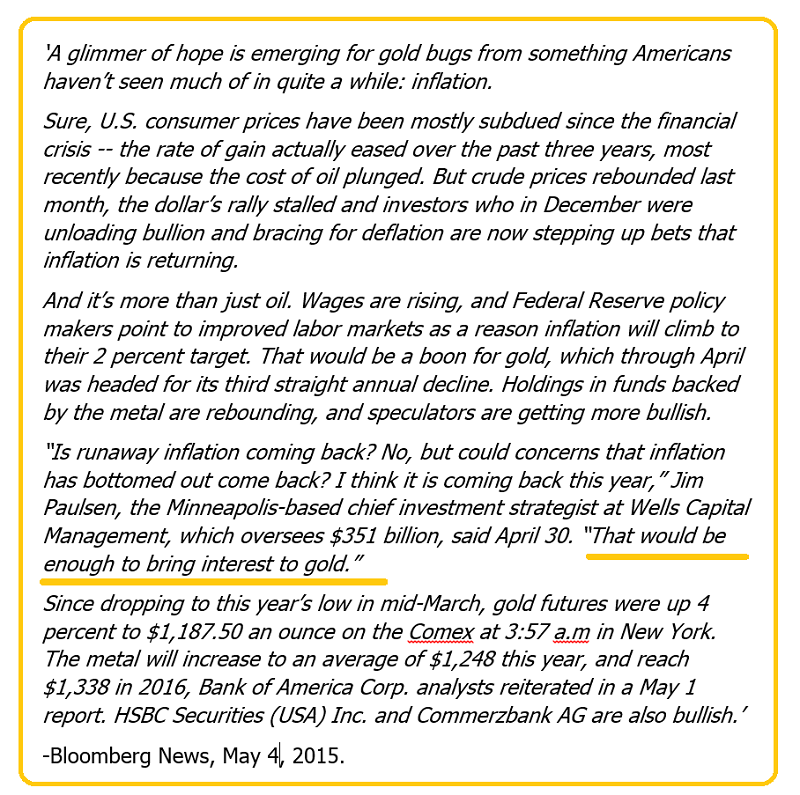
Heavyweight mainstream money managers like Jim Paulsen are clearly aware of the potential for inflation. Economists at Bank of America, HSBC, and Commerzbank are also “bullish” on gold, but looking for only slightly higher bullion prices in the next few years, which is the same view I have.
With US stock markets fizzling and talk of inflation growing, gold and silver stocks are set to take centre stage as the best performing asset class, for years to come.

That’s the daily GDX chart. It’s working its way over the key green downtrend line. A three day close above that line should trigger a rally towards $21.50, and maybe all the way to the $23.30 area.
While fear trade enthusiasts may be disappointed with the prospects of sideways action in bullion prices for years to come, that’s sideways action with an upwards bias, and much higher prices in gold and silver stocks. With asset classes like the Dow, T-bonds, and the dollar, I think the sideways action will carry a downside bias.
The gargantuan growth of the Chindian trade is changing the nature of gold, and the nature of gold investors. Historically, fear of lower prices is a key tool in the tool kit of every fear trade investor. That’s because when good times returned to Western economies, gold prices declined, and usually crashed. In contrast, the world is entering what I call a bull era, lead by China and India.
In Chindia, gold is bought both when times are good, and when times are bad. Chindian gold jewellery demand is already enormous. It’s mostly inelastic in China, fully inelastic in India, and growing at 8% - 15% a year in both countries, with mine supply struggling to grow at 2%. The bottom line: The Western gold investor now can get all the potential upside benefits of the fear trade, with a huge “love trade floor” cushioning current prices. Gold has never had a better risk/reward profile than it has now, and fully deserves its “ultimate asset” moniker.
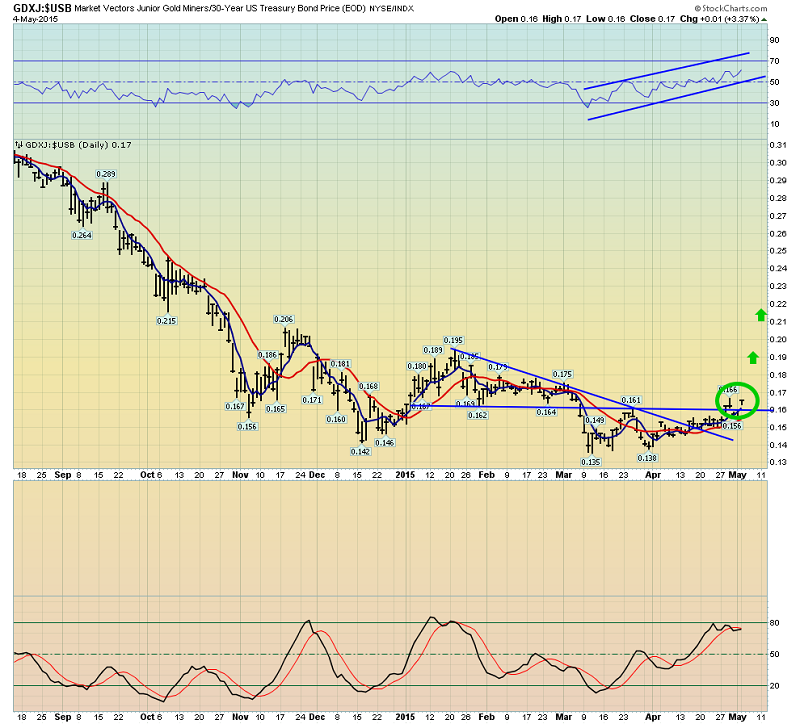
This is a very important chart. It’s the ratio chart of GDXJ compared to US T-bonds. Wealth is built and retained by buying one asset class when it is significantly on sale, compared to another one. GDXJ has declined by about 90% against T-bonds.
Borrowing money from banks to buy silly items like DUST-NYSE with leverage now, is not how to build wealth in a great asset class like junior gold stocks. I want to discuss asset ratios in relation to wealth building in more detail, because it’s one of the key tools that a wealth builder should have in their toolbox.
When the Dow:gold ratio declined from above 40 to 8, a lot of analysts brought up the theory that gold bull markets end with a Dow:gold ratio of 1:1. In contrast, I argued that when a major asset class falls from above 40 to 8, it needs to be bought systematically. The Chindian love trade has essentially destroyed the Dow:gold indicator’s relevance to gold investing. After touching about 6:1 at the recent lows, the current Dow:gold ratio is currently at about 15:1, the time to sell a bit of gold and buy the Dow is gone. The new major wealth building opportunity is showcased on the GDXJ-T-bond ratio chart.

That’s another look at the GDXJ:T-bond ratio chart, using monthly bars.
I’m looking for two things to send both junior and senior gold stocks soaring against T-bonds, and if they soar against T-bonds, I think they’ll soar against everything. First, I’m looking for a crossover buy signal of the 5,15 moving averages on that GDXJ chart. Second, I’m looking for a great US jobs report to stun mainstream media, and cause a rally in gold prices due to money manager concerns about inflation. The next jobs report comes out this Friday. Whether this is “the big one” or not is unknown, but all serious gold stock investors should have more confidence in their holdings now, than at any point in the history of gold stocks!
********
Special Offer For Gold-Eagle Readers: Please send me an Email to [email protected] and I’ll send you my free “Jack My Gold Stocks Ride” report! I highlight six great gold stocks that are flashing rally-now signals with my favourite 14,7,7 Stochastics series oscillator, with great upside potential!
Note: We are privacy oriented. We accept cheques. And credit cards thru PayPal only on our website. For your protection. We don’t see your credit card information. Only PayPal does. They pay us. Minus their fee. PayPal is a highly reputable company. Owned by Ebay. With about 160 million accounts worldwide.
Email: [email protected]
Rate Sheet (us funds):
Lifetime: $799
2yr: $269 (over 500 issues)
1yr: $169 (over 250 issues)
6 mths: $99 (over 125 issues)
To pay by cheque, make cheque payable to “Stewart Thomson”
Mail to:
Stewart Thomson / 1276 Lakeview Drive / Oakville, Ontario L6H 2M8 Canada
Stewart Thomson is a retired Merrill Lynch broker. Stewart writes the Graceland Updates daily between 4am-7am. They are sent out around 8am-9am. The newsletter is attractively priced and the format is a unique numbered point form. Giving clarity of each point and saving valuable reading time.
Risks, Disclaimers, Legal
Stewart Thomson is no longer an investment advisor. The information provided by Stewart and Graceland Updates is for general information purposes only. Before taking any action on any investment, it is imperative that you consult with multiple properly licensed, experienced and qualified investment advisors and get numerous opinions before taking any action. Your minimum risk on any investment in the world is: 100% loss of all your money. You may be taking or preparing to take leveraged positions in investments and not know it, exposing yourself to unlimited risks. This is highly concerning if you are an investor in any derivatives products. There is an approx $700 trillion OTC Derivatives Iceberg with a tiny portion written off officially. The bottom line:
Are You Prepared?
 Stewart Thomson is president of Graceland Investment Management (Cayman) Ltd. Stewart was a very good English literature student, which helped him develop a unique way of communicating his investment ideas. He developed the “PGEN”, which is a unique capital allocation program. It is designed to allow investors of any size to mimic the action of the banks. Stewart owns GU Trader, which is a unique gold futures/ETF trading service, which closes out all trades by 5pm each day. High net worth individuals around the world follow Stewart on a daily basis. Website: www.gracelandupdates.com.


