30-Year US T-Bonds Analysis


We are looking for a final top to the massive bond bull market that began in 1981. While it is possible the final top is in place, I am leaning to one final marginal high before everything goes belly-up.
Let’s review the quarterly and weekly charts of the 30-Year US Treasury Bond price.
30-YEAR US T-BOND QUARTERLY CHART

This chart was shown in previous analysis back in June 2016. That analysis outlined the expectation for a top this quarter. So far that appears to be the case but I am now having doubts. In the back of my mind is one of my weaknesses in thinking things will play out quicker than they actually do. I am continually being made to be patient and I suspect this time will be another of those times.
This will likely be determined by the US Fed meeting later in September. Increasing rates at that meeting would probably mean the top is in place but I now favour rates to remain unchanged with the rate increase to occur in December this year. This speculation of the fundamentals is based purely on how I view the technicals.
I favour price to make one final marginal high, or possibly a lower high, in the final quarter and then a rate increase in December confirms it.
Anyway, we can see a “three strikes and you’re out” top formation in play. This is just the expression I give to the pattern of three peaks or troughs. I’ve seen some technicians try to claim this as their own. Bollocks. I first learnt it through Gann teachings but it may have been discovered before then.
The Bollinger Bands show price up the upper band and the next time price leaves this band will likely signify the bull market is over.
I have drawn a Fibonacci Fan from the 1981 low. Previous analysis outlined the expectation for price to do fake out move above the 61.8% angle and price has now done this and is perhaps still in the process of doing so.
The RSI shows a quintuple bearish divergence setting up here while the MACD indicator is bullish with eth averages diverged so this really does appear to be a ticking time bomb.
Let’s look in closer with the weekly chart.
30-YEAR US T-BOND WEEKLY CHART
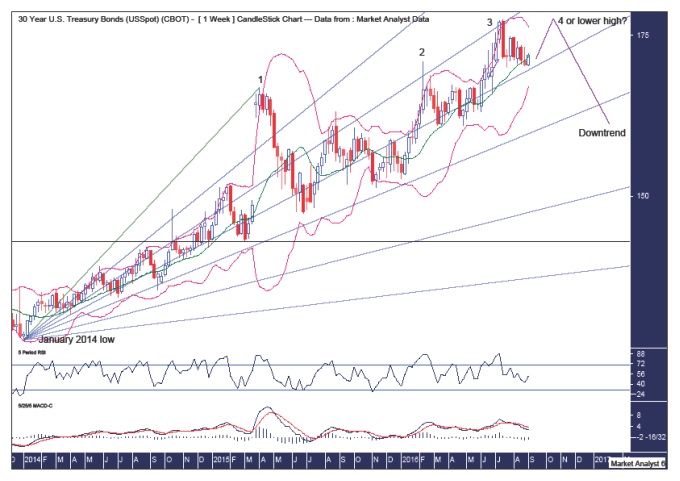
I showed this chart in previous analysis and the expectation was for a third and final strike high. Well, we have the third strike high in place but I now suspect the final high will occur on the fourth strike.
A lower high is also a possibility but I personally lean to one more marginal high.
The Bollinger Bands show price is back down around the middle band and I favour support to come in here and send price back up for one last lash at the upper band.
I have drawn a Fibonacci fan which shows the third strike high at resistance from the 38.2% angle. Price is now down near support from the 50% angle and I favour this support to hold and send price back up to one final high although I doubt price will get back to the 38.2% angle.
The RSI doesn’t show any bearish divergences on this chart so perhaps one final high will rectify that.
The MACD indicator is bearish so caution is clearly required for those bulls still playing the long side.
Consequently, a final high to the 35 year bond bull market really does appear imminent if it isn’t already in place of course.
********
© 2016 Copyright The Voodoo Analyst - All Rights Reserved
Disclaimer: The above is a matter of opinion provided for general information purposes only and is not intended as investment advice. Information and analysis above are derived from sources and utilising methods believed to be reliable, but we cannot accept responsibility for any losses you may incur as a result of this analysis. Individuals should consult with their personal financial advisors. Put simply, it is JUST MY OPINION.


