Analysis Of The CRB Index


Let’s start with the CRB index which built out a one year bearish rising wedge formation that broke to the downside in March of this year. The price action has been chopping to the downside and has gotten a bounce to the upside in late June. Normally the price objective of a rising wedge is down to the first reversal point where the pattern started to build out.
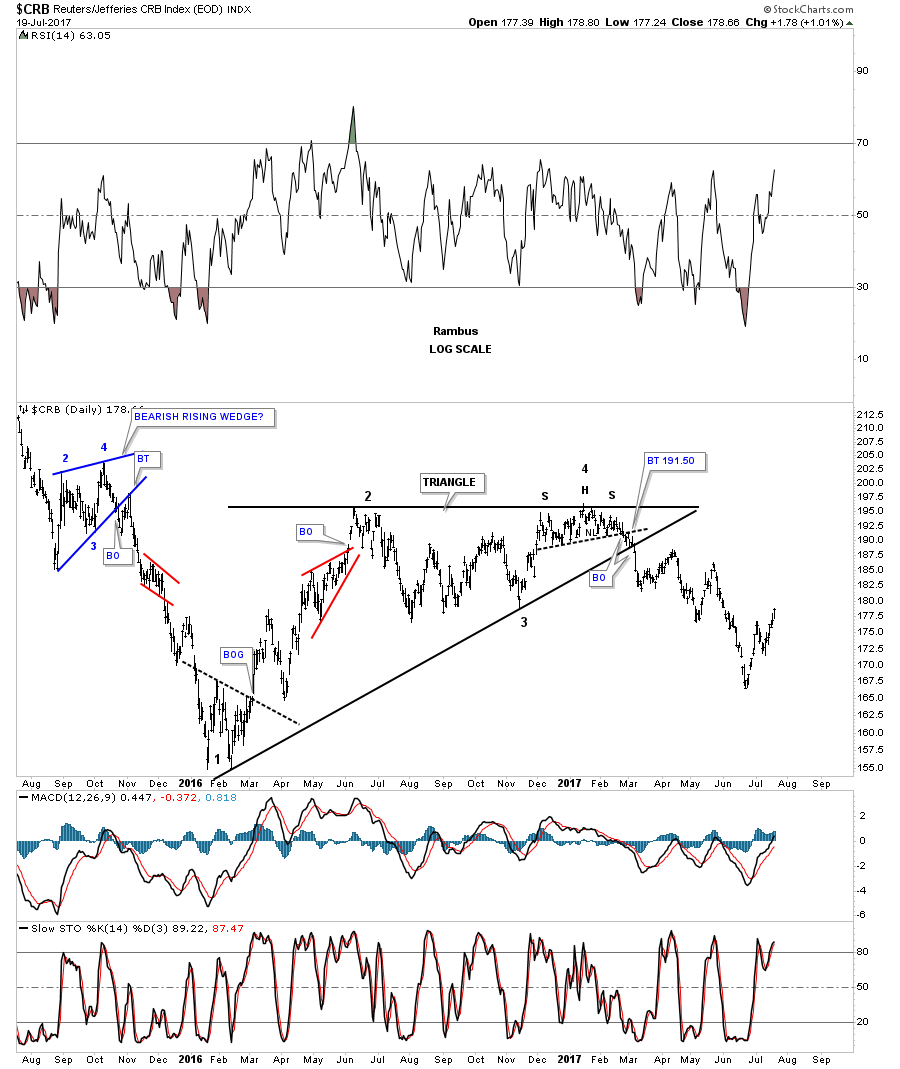
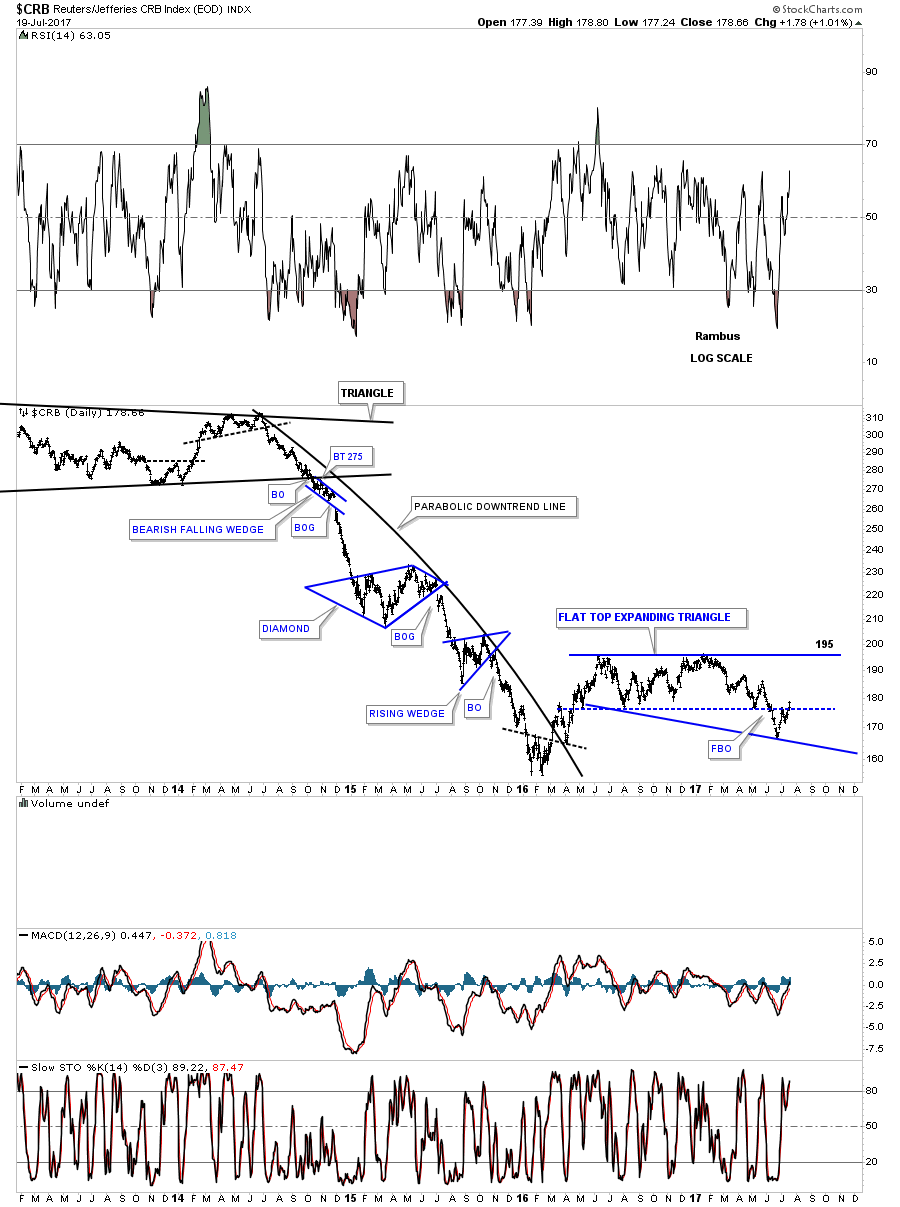
There is another pattern I’ve been keeping a close eye on which may have given us a good clue today that we may have a consolidation pattern building out which is forming above the January 2016 low. As you can see on this long term daily chart for the CRB index it has built out a sideways trading range which broke to the downside last month, which wasn’t a bullish development if one was bullish on this index.
Expanding patterns, whether they’re a triangle, flat top or flat bottom, expanding falling wedges or expanding rising wedges, are some of the more difficult formations to find in real time. The reason being is that with the pattern on this daily chart below shows a false breakout below the bottom rail, blue horizontal dashed line, which looks like a breakout to the downside. With today’s price action closing back above the blue dashed line we now have a potential flat top expanding triangle. If the price actions can close above the top horizontal trendline, the flat top triangle will be the first consolidation pattern in the CRB’s index’s new bull market.
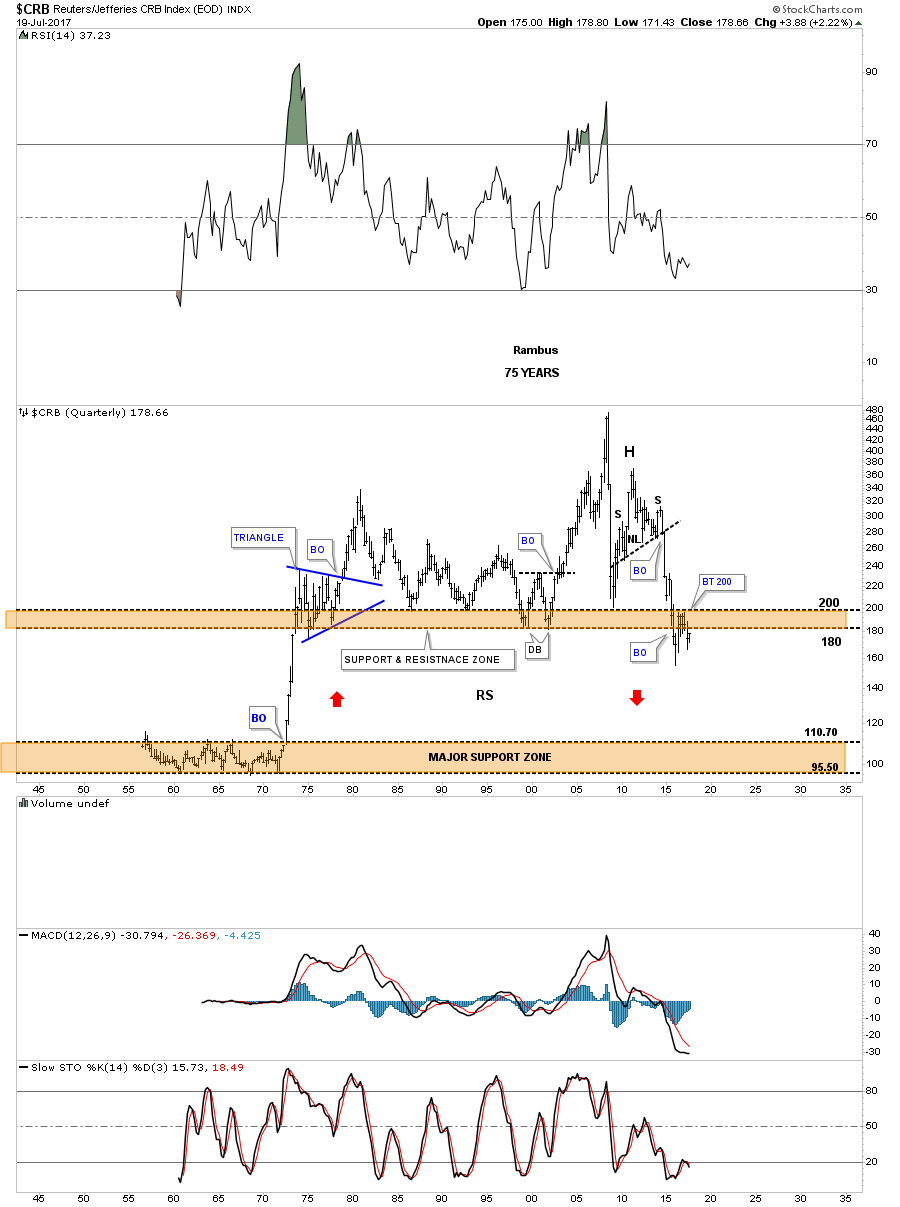
This 75 year quarterly chart for the CRB index shows you just how bad the bear market has been. To really get this index bullish again I would love to see the price action trading back above the brown shaded S&R zone above 200 or so, which would create an unbalanced double bottom. By looking at the daily chart above you can see how the unbalanced double bottom would look like if the top rail of the expanding flat top triangle is broken to the upside. If the possible unbalanced double bottom plays out we are just in the first inning of a 9 inning game.
********
 Meet Rambus, a seasoned trader and technical analyst renowned for his unbiased and insightful chart work. Through his website, Rambus Chartology, and Substack newsletter, Rambus shares his expertise with a global community of subscribers, providing daily updates, commentaries, and hands-on training in the art and science of chartology. With his calm, humble, and down-to-earth approach, Rambus demystifies complex market trends, helping his followers navigate the challenges of today's volatile markets. Join the Rambus Chartology community today and discover a unique blend of technical analysis, trading expertise, and time-tested protocols. Subscribe now at www.rambus1.com or https://rambuschartology.substack.com/


