"Battle Stations" For 'Da Boyz' In New York On Friday
 share
share
 share
share
 share
share
 share
share
 share
share
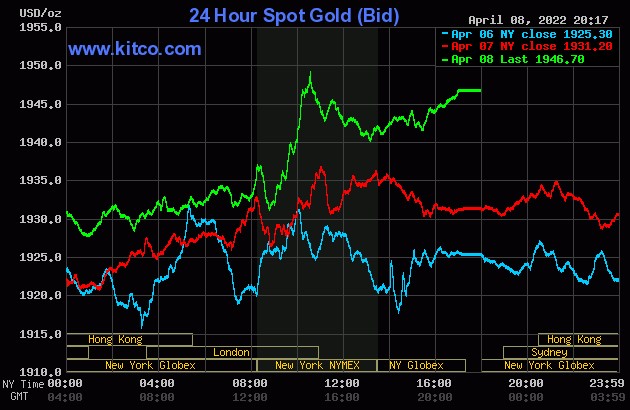
The gold price wandered quietly lower in the Far East on their Friday morning -- and the low tick of the day was set around 1 p.m. China Standard Time on their Friday afternoon. It then wandered quietly higher from there until about five minutes before the COMEX open -- and was then sold lower until 8:45 a.m. EDT. The ensuing rally was capped minutes after 10 a.m. in New York, which may or may not have coincided with the afternoon gold fix in London. It was sold quietly lower from that point until around 1:10 p.m. -- and then crawled quietly higher until the market closed at 5:00 p.m. EDT.
The low and high ticks in gold were reported as $1,930.40 and $1,952.20 in the June contract. The April/June price spread differential in gold at the close yesterday was $4.00...June/August was $6.60...August/October was $6.40 -- and October/December was $7.60 an ounce.
Gold was closed in New York on Friday afternoon at $1,946.70 spot, up $15.50 from Thursday. Net volume was very light at 129,500 contracts -- and there was a bit under 14,500 contracts worth of roll-over/switch volume on top of that...mostly into August and December.
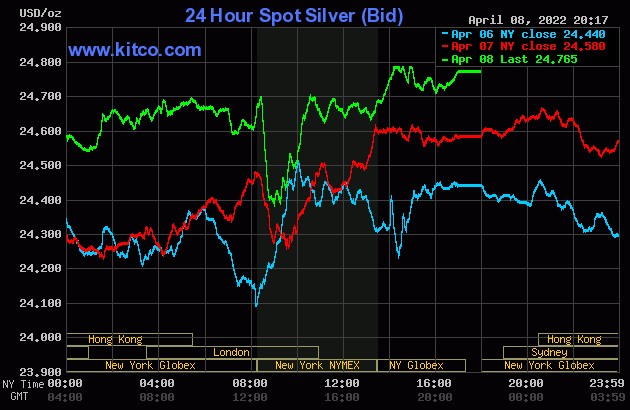
Silver's price path was mostly similar gold's in GLOBEX trading...but only up until a minute or so before 8:30 a.m. in New York. It was then hammered lower, with its low tick coming at exactly 9:00 a.m. EDT. Its ensuing rally was capped at the same moment as gold's -- and from that juncture it wandered very quietly lower until 1:10 p.m. At that point it made another bolt for freedom, but ran into a brick ceiling at $24.79 spot around 2:10 p.m. EDT. A quiet down/up move followed for the remainder of the after-hours trading session.
The low and high ticks in silver were recorded by the CME Group as $24.495 and $24.935 in the May contract. The May/July price spread differential in silver at the close in New York yesterday was 8.5 cents...July/September was 8.8 cents... September/December 14.0 cents an ounce.
Silver was closed on Friday afternoon in New York at $24.765 spot, up 18.5 cents from Thursday. Net volume was very much on the lighter side at 34,500 contracts -- and there was around 19,700 contracts worth of roll-over/switch volume in this precious metal...mostly into July, with a bit into September.
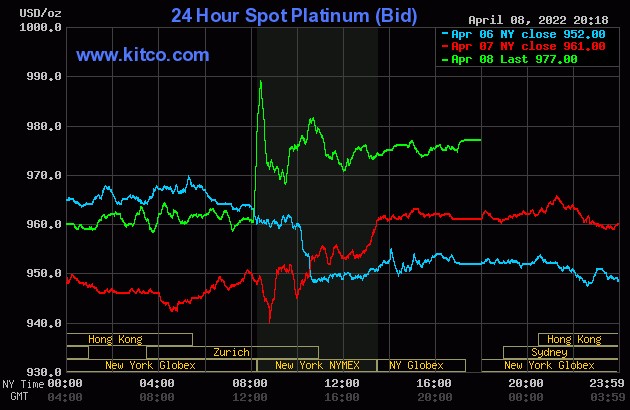
Platinum wandered/chopped very quietly sideways throughout all of the GLOBEX trading session overseas -- and that ended with a bang minutes after 2 p.m. in Zurich/8 a.m. in New York when this LPPM news hit the wires. The price went near vertical, but 'da boyz' stepped in about thirty minutes later to cap that rally -- and then drive it lower. That sell-off lasted until around 9:35 a.m. EDT -- and its ensuing rally ran into the same fate -- and its price was returned to 'trend' at exactly noon in New York. It was allowed to crawl a bit higher until trading ended at 5:00 p.m. Platinum was closed at $977 spot, up 16 bucks on the day -- and 22 dollars off its Kitco-recorded high tick.
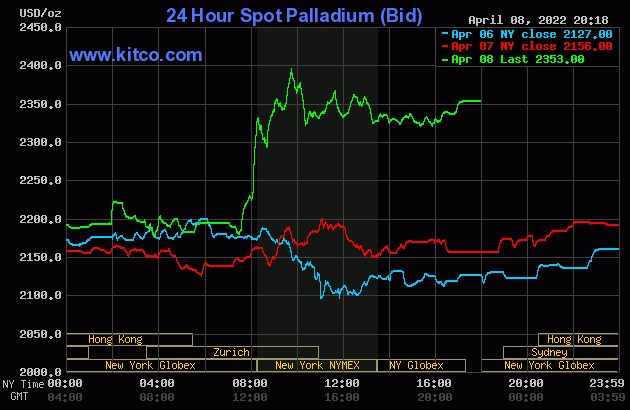
Palladium rallied to around the $2,200 spot mark by around 10 a.m. China Standard Time on their Friday morning -- and then traded rather unevenly sideways to a bit lower until around 1:30 p.m. in Zurich. It began to head sharply higher from there -- and then piggy-backed on the same LPPM news starting minutes after 2 p.m. CEST/8 a.m. EDT. The Big 4/8 shorts finally got the price capped around 9:45 a.m. during the COMEX trading session in New York -- and it was sold lower until around 10:20 a.m. EDT. >From that juncture it was forced to chop/wander quietly sideways until trading ended at 5:00 p.m. Palladium was closed at $2,353 spot, up $197 on the day -- and 42 dollars off its Kitco-recorded high tick.
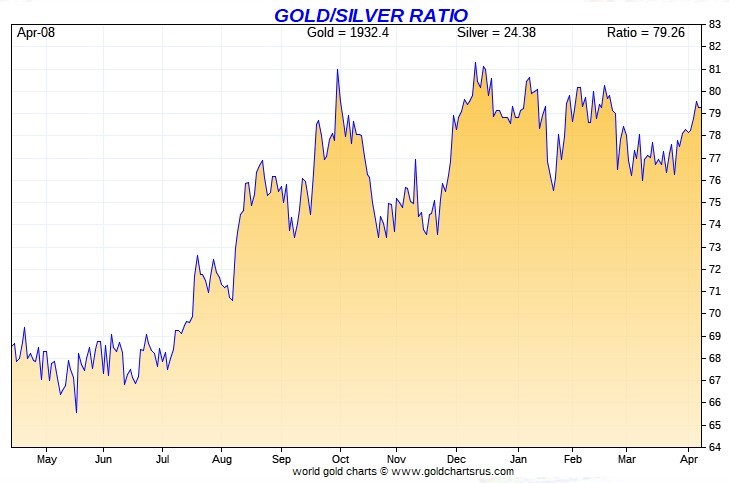
Based on the kitco.com spot closing prices in silver and gold posted above, the gold/silver ratio worked out to 78.6 to 1 on Friday...unchanged from Thursday.
And here's Nick Laird's 1-year Gold/Silver Ratio chart, updated with this week's data. Click to enlarge.
--------
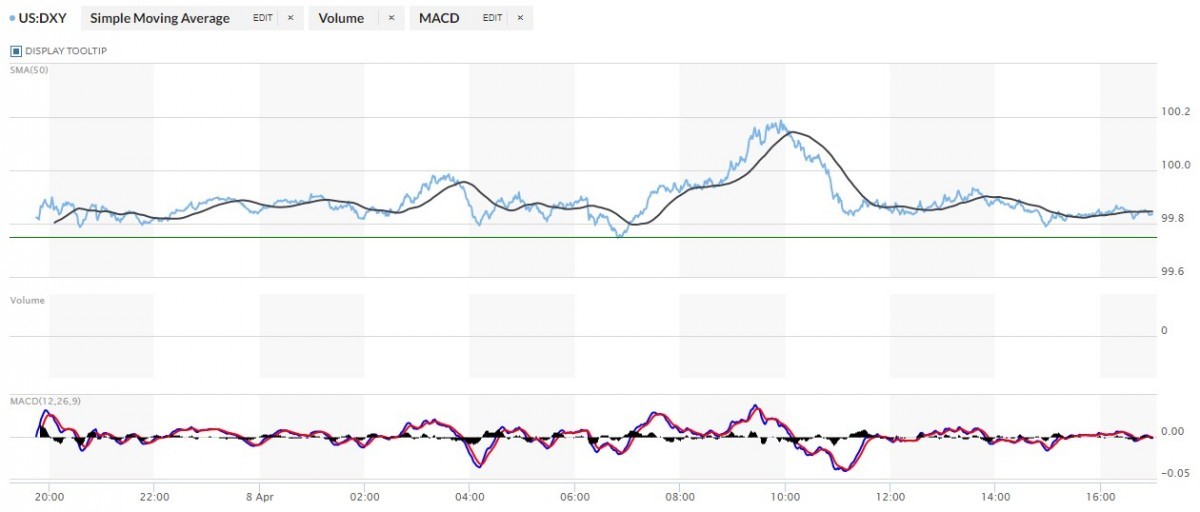
The dollar index closed very late on Thursday afternoon in New York at 99.75 -- and then opened higher by 7 basis points once trading commenced at 7:45 p.m. EDT on Thursday evening, which was 7:45 a.m. China Standard Time on their Friday morning. It rallied a bit from there over the next fifteen minutes or so -- and then proceeded to wander quietly sideways to a bit lower until around 11:50 a.m. in London. Its ensuing rally topped out at 9:55 a.m. in New York -- and it was then sold quietly lower until around 11:12 a.m. EDT. It then wandered quietly sideways from that juncture until the market closed at 5:00 p.m.
The dollar index finished the Friday trading session at 99.84...up 9 basis points from its close on Thursday.
Here's the DXY chart for Friday, thanks to marketwatch.com. Click to enlarge.
And here's the 5-year U.S. dollar index chart that appears in this spot in every Saturday column, courtesy of stockcharts.com as always. The delta between its close...99.75...and the close on the DXY chart above, was about 9 basis points below its spot close on the DXY chart above. Click to enlarge.
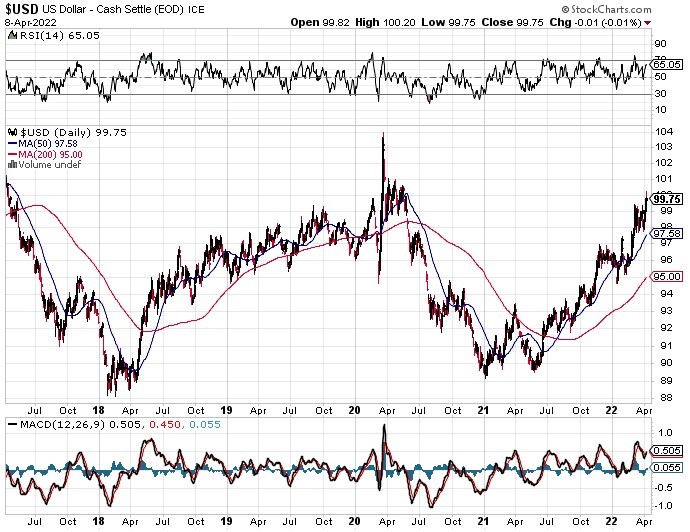
One again there was zero correlation between the currencies and what was happening with regards to precious metal prices.
U.S. 10-Year Treasury: 2.7130%...up 0.0610 (+2.30%)...as of 02:59 p.m. EDT
Here's the 5-year 10-year U.S. Treasury chart from the yahoo.com Internet site -- and it puts the yield curve into a somewhat longer-term perspective. Click to enlarge.
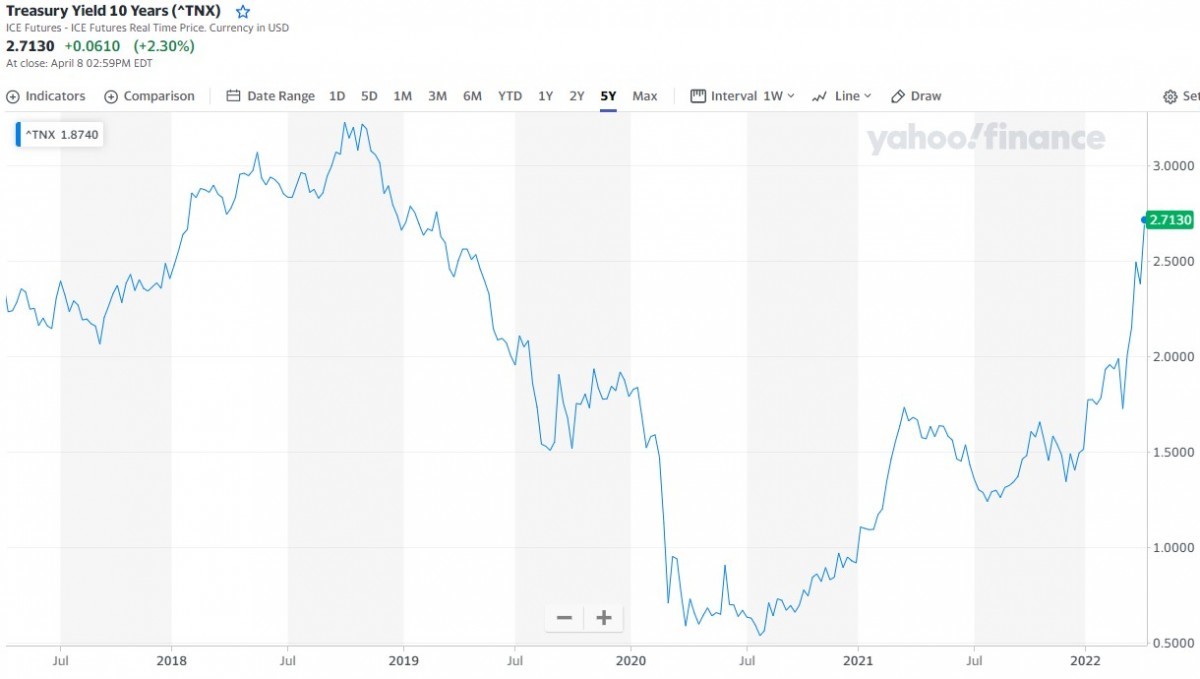
As you are more than aware, the only reason that yields are where they are, is because the central banks of the world continue to buy up virtually all, if not all of the sovereign debt being issued. That isn't about to stop anytime soon, as Japan just announced very recently -- and the European Central Bank was in a snit about yesterday in this Zero Hedge article from Richard Saler linked here.
As the saying goes "bonds are guaranteed certificates of confiscation" -- and that fact is now on full display in all the bond markets of the world. The Fed says it's going to be unwinding its balance sheet -- and the obvious question on everyone's lips is..."who's going to buy them?"
---------
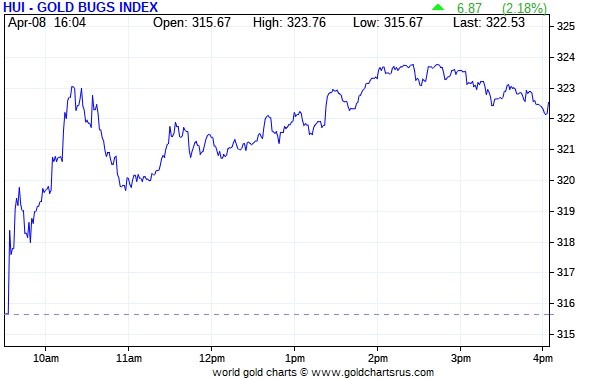
The gold shares began to head higher right from the moment that trading began at 9:30 a.m. in New York on Friday morning -- and that lasted until around 10:20 a.m. EDT. They were then sold a bit lower until a few minutes before 11 a.m. They began to creep higher from there, with their respective highs coming around 2:25 p.m. EDT. They were sold a bit lower until the market closed at 4:00 p.m. The HUI finished up 2.18 percent.
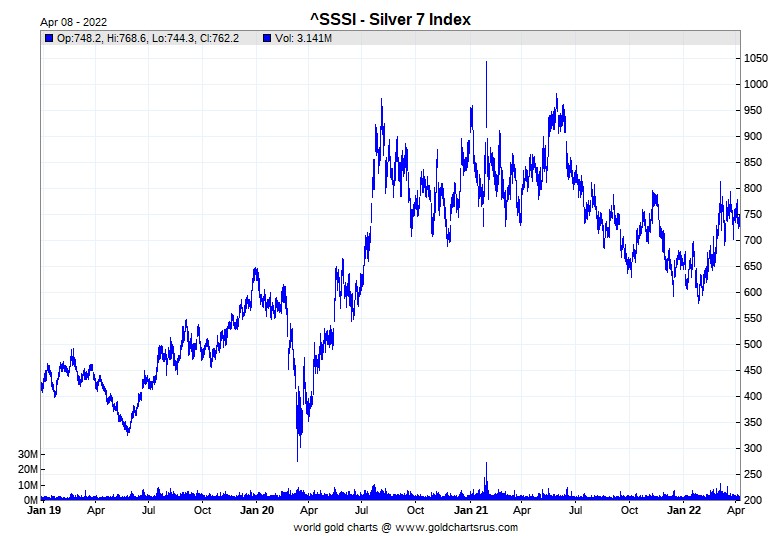
Computed manually, Nick Laird's Intraday Silver Sentiment/Silver 7 Index closed up 2.69 percent.
And here's Nick's 3-year Silver Sentiment/Silver 7 Index chart, updated with Friday's candle. Click to enlarge.
The star yesterday was SSR Mining, as it closed higher by 4.20 percent -- and the biggest underperformer was Peñoles, as it closed up only 1.14 percent on 7,600 shares traded.
The latest silver eye candy from the reddit.com/Wallstreetsilver crowd is linked here.
--------
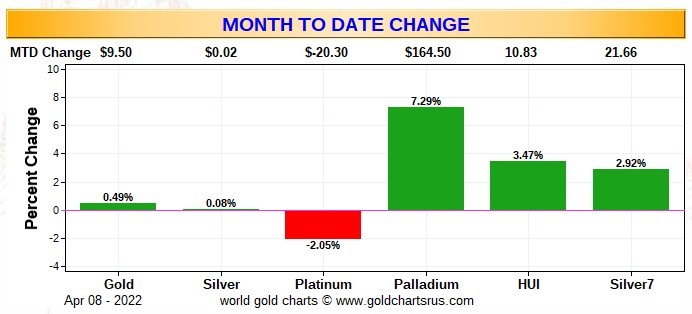
Here are two of the three usual charts that show up in every weekend missive. They show the changes in gold, silver, platinum and palladium in both percent and dollar and cents terms, as of their Friday closes in New York — along with the changes in the HUI and the Silver 7 Index.
Here's the month-to-date chart...and it's green across the board, except for platinum. The Silver 7 Index would be doing a little better if Peñoles wasn't part of it, but there's nothing that can be done about that. Click to enlarge.
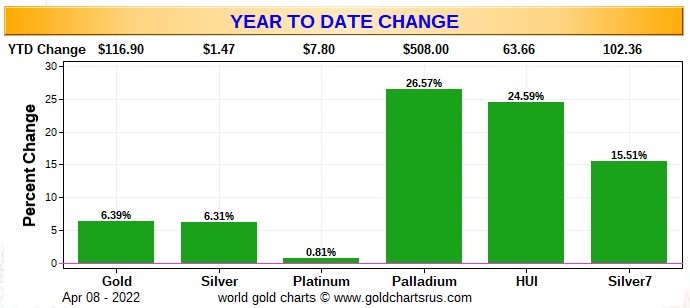
Here's the year-to-date chart -- and it's still wall-to-wall green...with the silver stocks being the underperformers vs. its underlying precious metal so far this year. That will obviously change at some point. Palladium's gain year-to-date is impressive...but obviously down a very considerable amount because of the pounding it has taken during the last month. It would have been down even more, except for its strong rally yesterday -- and platinum got saved for the same reason. Click to enlarge.
Of course how much more in the way of gains were going to see going forward continues to be in the hands of the commercial traders of whatever stripe, as they alone control the price of everything precious metals-related...until they don't.
--------
The CME Daily Delivery Report for Day 8 of April deliveries showed that 62 gold and 11 silver contracts were posted for delivery within the COMEX-approved depositories on Tuesday.
In gold, there were five short/issuers in total -- and the three biggest were Japanese trading house Mizuho, Goldman Sachs and Morgan Stanley, with 28, 15 and 15 contracts out of their respective client accounts. There were eight long/stoppers in total -- and the three largest there were JPMorgan and British bank Barclays, picking up 25 and 11 contracts for their respective client accounts... followed by Citigroup, stopping 11 contracts for their house account.
In silver, the only short/issuer was Morgan Stanley -- and the two long/stoppers were JPMorgan and ADM, as they picked up 8 and 3 contracts. All contracts, both issued and stopped, involved their respective client accounts.
In platinum, there were 44 contracts issued and stopped.
*******
share
share
share
share
share