Bonds May Collapse While The Fed Injects QE4


Since I wrote my last bond article, we have seen many events which market participants assume have an effect upon the bond market.
We have recently seen the Fed lower its rate, in addition to coming to the table with its “not really QE 4” of $60 billion - and rising. Yet, rates have been heading higher. Does that make you scratch your head?
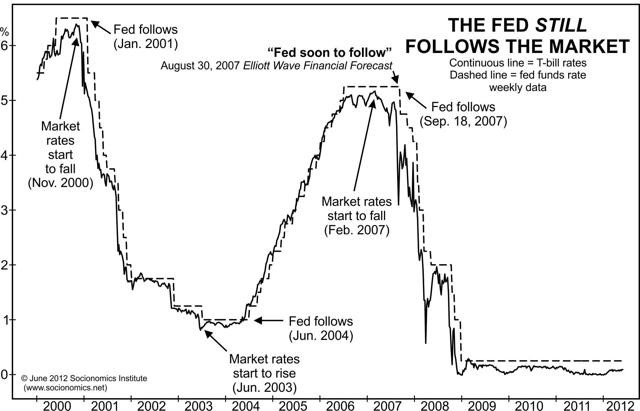
Well, I have said many times in the past that the market controls rates and the Fed, and I still stand by that perspective. In fact, my prior articles have evidenced how history supports my perspective. Moreover, while we often see evidence of this fact supported by history, many market participants are unwilling to take their blinders off to this truth. Just look at this chart published by Elliott Wave International and it should settle this issue:
So, the question is which way is the market going to take rates over the coming months?
But before we move into our analysis, allow me to post a recap of our analysis in bonds, which I have provided in past articles:
“Let me take a moment to recap my recent history and perspective on bonds. For those that followed our work over the years, you would know that we called for a top to the bond market on June 27, 2016, with the market striking its highs within a week of our call. Right after that top call, TLT dropped 22%, until we saw the bottoming structure develop in late 2018.
So, in November of 2018, I noted to my subscribers that I was going long TLT just as it broke below the 113 level. At the time, many were telling me that I was crazy to go long bonds, as the Fed was still raising rates. The main reason many thought I was crazy was that “you cannot fight the Fed.”
Well, in my case, I recognized that the Fed cannot fight the market. And, the market was suggesting to me that it was bottoming out and about to turn up quite strongly. In fact, back in the fall of 2018, we set our minimum target for this rally at the 135/136 region. As the market rally developed in structure, we began to look towards the 139/140 region. And, when the market struck the 140 region, I took my profits on the longs we entered at 112/113.
Admittedly, I did not capture the further rally in TLT from 140 to 149. But, I also recognize that I will never be able to capture every point the market offers. So, I was quite satisfied with banking the gains we earned from 113 to 140. And, for those that may not realize it, I raised cash when the stock market broke below the 2880SPX region last year, and placed that money into TLT. Since then, the market is 4% higher than when I took out my cash, whereas I earned 24% on that cash in the TLT.
Moreover, I also recognized that the market was going to come back down to my exit point and I would then be able to determine if I want to re-enter the market. In fact, on September 1st, I wrote the following:
“At this point in time, I am seeing a structure developing a top in the TLT. While the TLT may see a bit higher before it turns down, I think the market can drop back down to the 137-140 region in the coming months. And, depending upon how the market pulls back into this target region will tell me if I should consider another long position to target the 151+ region. But, that will be a game time decision in the coming months, as it will all depend upon market structure.”
The very next day that the market opened, the TLT began a decline which has seemingly bottomed at the 136.54 level.”
Since that bottom was struck, TLT has rallied in what can be counted as a 5-wave structure. However, once that rally completed, the decline off the top of that rally also seems to be best counted as a 5-wave structure. This leaves the market in an uncertain posture. Unfortunately, we will not always have a solid read of the market, and I would note that this is one of those times within the bond market. But since many have been asking my opinion of TLT, I thought I would at least explain my perspective in a public article - which, at this time, is somewhat uncertain.
In The Elliott Wave Principle, there is a paragraph by Frost & Prechter which I believe is extremely applicable to us today:
“Of course, there are often times when, despite a rigorous analysis, there is no clearly preferred interpretation. At such times, you must wait until the count resolves itself. When after a while the apparent jumble gets into a clearer picture, the probability that a turning point is at hand can suddenly and excitingly rise to nearly 100%.”
So, should TLT now rally in a corrective 3-wave structure and then break down below $136.50, we are likely going to see TLT drop further to the $125-130 region before I would even re-consider a long position.
However, if TLT can muster an impulsive 5-wave rally off this week’s low, then that would suggest we are heading to $155+ sooner rather than later.
At this point in time, I would give the edge to the more immediate decline scenario. But I will be watching this chart carefully over the coming two weeks for confirmation.
See chart illustrating Avi's wave counts on the TLT.
Avi Gilburt is a widely followed Elliott Wave analyst and founder of ElliottWaveTrader.net, a live trading room featuring his analysis on the S&P 500, precious metals, oil & USD, plus a team of analysts covering a range of other markets.
********
 Avi Gilburt is a widely followed Elliott Wave technical analyst and author of ElliottWaveTrader.net, a live Trading Room featuring his intraday market analysis (including emini S&P500, metals, oil, USD & VXX), interactive member-analyst forum, and detailed library of Elliott Wave education. You can contact Avi at: [email protected].
More from Gold-Eagle


