Calm Before The Proverbial Storm?


 Last week was a typical example of the ‘Slowly but surely’ heading of US Markets of the previous weekend; a case of two steps forward and then one back. Sometimes two. ‘Marking time’ is another expression often used for the kind of behaviour when there is much activity, yet not any significant progress in any direction. A look at a long enough chart of most important market indicators reveals that ‘marking time’ is the best description of what has been happening in these markets for a good many years now. This is reflected in the fact that the majority of the charts show merely small changes for Friday’s closing prices from those of the week before.
The DJIA first hit the 18000 level to much fanfare in December 2014, then played around near that level for six months with no real progress. Since then it has twice fallen steeply to below 16000, only to reverse higher on both occasions as steeply as the collapse in a show of near miraculous levitation. The first attempt to recover back above the important 18000 level just failed. However, the second attempt made it hold above that level for a total of five days, but not consecutively!
Last week also offered a prime example of the strange new world in which we live. The Non-Farm Payroll came in at 160k, 40k below the consensus to signal a deteriorating labour market and a weak economy; something that is not good for equities, right? As the first reaction, as logic would have it, the market fell but recovered as quickly until it managed to break even on the day. Sellers who could not believe their luck to have a second opportunity sold until a new low for the day was reached. From then on the bull dominated the market, but not without a struggle, until the market closed at a gain of 82 points, near its highs for the day.

The question is of course who is doing the buying? In part, we know that there are vested interests that perceive Wall Street as the magician’s tophat from which the illusion of a growing economy can be dragged repeatedly by the ears, like a rabbit, provided the DJIA can be supported to reach 18 000. Again. Investors are absent, except perhaps for the few who believe that Wall Street will embark on another leg of the post-2008 long term bull market.
Then there have to be the speculators who gleefully at another trading opportunity are confident the 18000 level is in sight again now that it is evident that a new rate hike in June is most unlikely – and perhaps not even during the rest of 2016 if the labour trend should persist. Their view is the Fed will not dare to add a rate hike to an already comatose economy. Consequently, the market will view this as bullish for the short to medium-term. Given the strange ways of the markets recently, they may well be right to take the gamble.
The opening of the Shanghai Gold Exchange brought the jump in prices of gold and silver that was expected. However, the buyers there, presumably mostly Chinese, soon applied all the knowledge of a 4,000-year civilisation to realise that the old ‘Buy low-Sell high’ rule still applies. If someone is willing to sell you something at $10, it is stupid to be bidding $11. Waterfall attacks still continued on Comex, at times when the SGE is closed…and may even have been present on the SGE, just not as blatantly as in New York.
The result is that the metal prices also fell into the two steps forward and one step back syndrome, churning mostly sideways within a broad range accompanied by volatility. It seems that the advice of ‘Sell in May and go away’ could apply to metal prices too. Yet the rising trends on the charts of the gold and silver monthly close show that the bull trends that started around the end of 2015 are still intact. Next resistance for the monthly close is at $1364 for gold and at $20.09 for silver.
Euro-Dollar
On Friday, gold’s PM fix was just $5 more than at the end of the previous week – a sign of the sideways churning in so many markets. This is a far cry from the weeks after the start of 2016…and also during the first week after trading had begun on the SGE. Quiet sideways trading on the latter is perhaps the main reason for a lack of fireworks in the gold market, but then, why chase the price if sellers are willing to sell in quantity at the low price?
As is so often said, the supply squeeze has to tighten before a scramble for supply will impart a consistently rising trend to the price. This applies to gold and silver, of course, but the situation is clouded by the apparent use of the gold price to place more pressure on that of silver. Yet last week gold was the more steadfast, despite many attempts to push the price lower. All dips in the price reversed quickly after limited downward moves as a sign that buyers are waiting for bargains, but not willing to chase the price above $1300/oz.

Euro-dollar, last = $1.1404 (www.investing.com)
Dow Jones Industrial Average (DJIA)
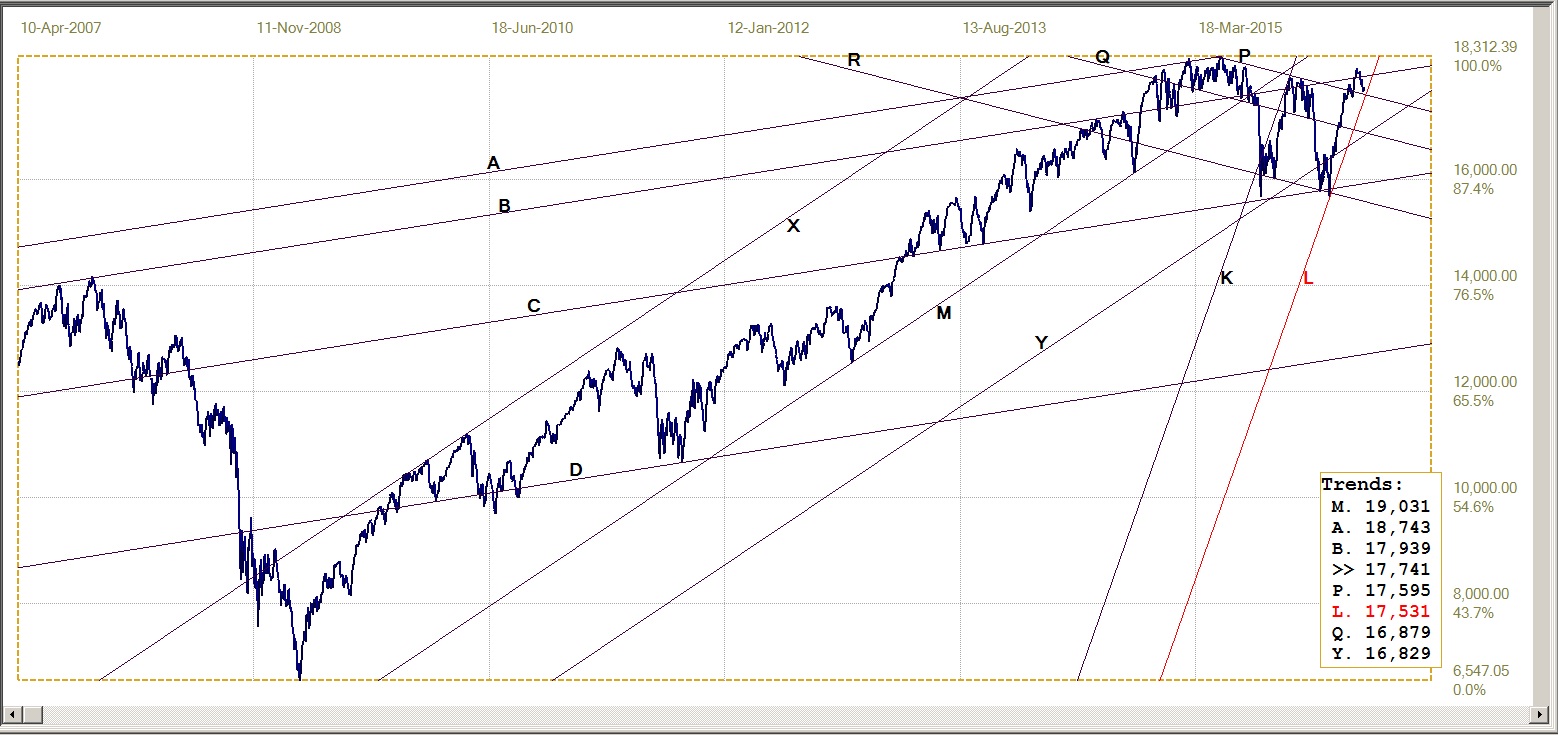
Dow Jones Industrial Index, last = 17741 (money.cnn.com)
As mentioned in the introduction, the steep and remarkable levitation in the DJIA to remain in steep bull channel KL, only had limited success at the 18 000 level. After intermittently closing above that level on five occasions, the index slipped lower to settle closer to the mid 17 000s. This dip, together with the sideways move as time passes, has brought the DJIA now close to testing the steeply rising support along the lower side of bull channel KL (17531). Resistance at line B (17939) is still below the 18 000 level and could be tested if the enthusiasm of speculators for the stock market, given a low probability of any rate increase soon, is sustained.
Line P (17959) acted as strong resistance in the past and could be expected to now offer good support should it be tested. That support, in combination with support at line L, suggests that a move lower may not be imminent at this time. However, at the rate line L is heading higher, the DJIA has to start moving higher soon to keep within the steep bull channel.
Gold PM fix - Dollars
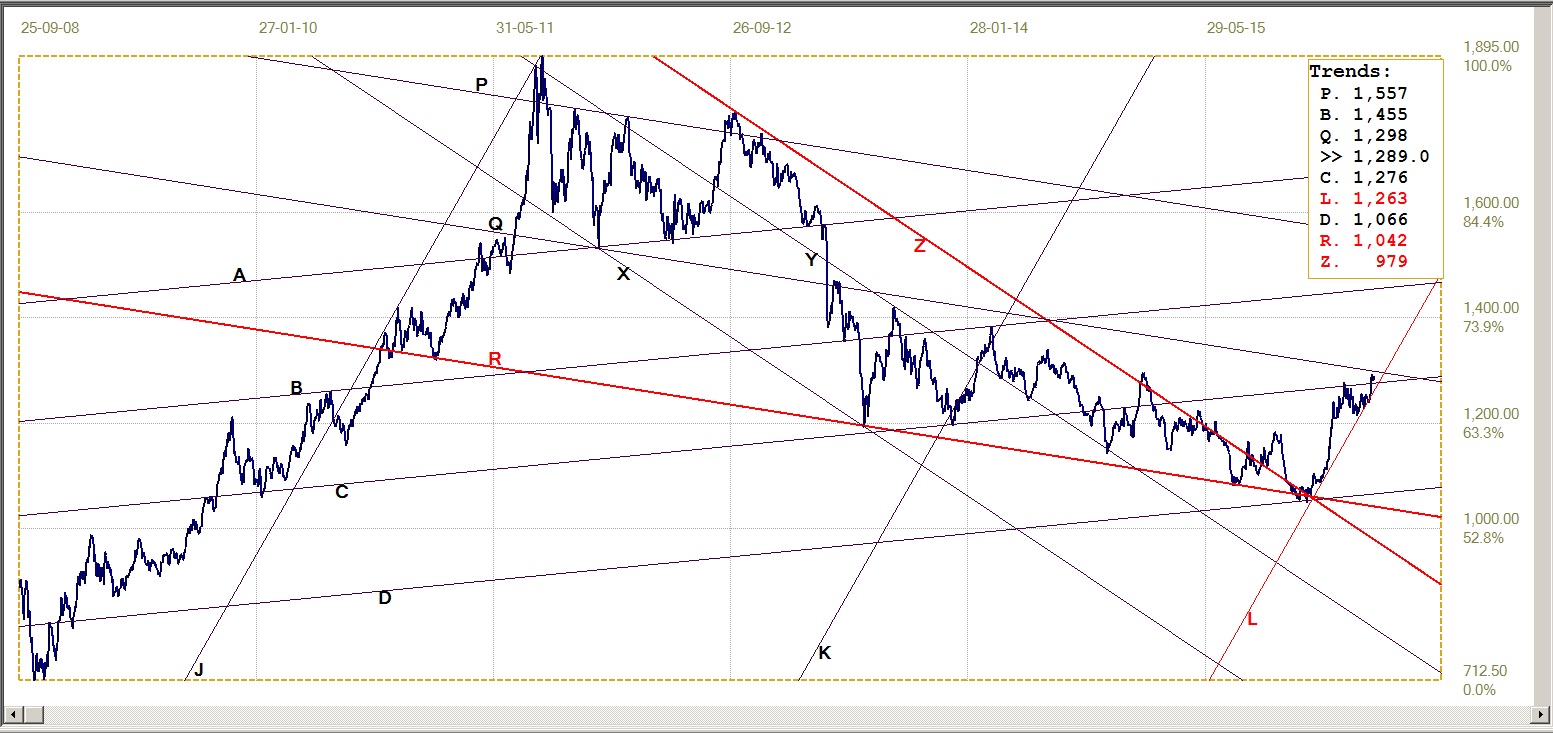
Gold price – London PM fix, last = $1289.0 (www.kitco.com)
Given the sustained pressure on the price of gold since about the middle of March, it is a wonder the gold price managed to cling to the steeply rising support of bull channel KL. Then, for the past week, gold managed to hold clear above support at line C ($1276), despite the more confident waterfall attacks on Comex. At the same time, the $1300 barrier has prevented a full-scale challenge on resistance at line Q ($1298). Doing so, probably with good success, could be quite soon, provided that channel KL can hold.
Gold PM fix - Euro
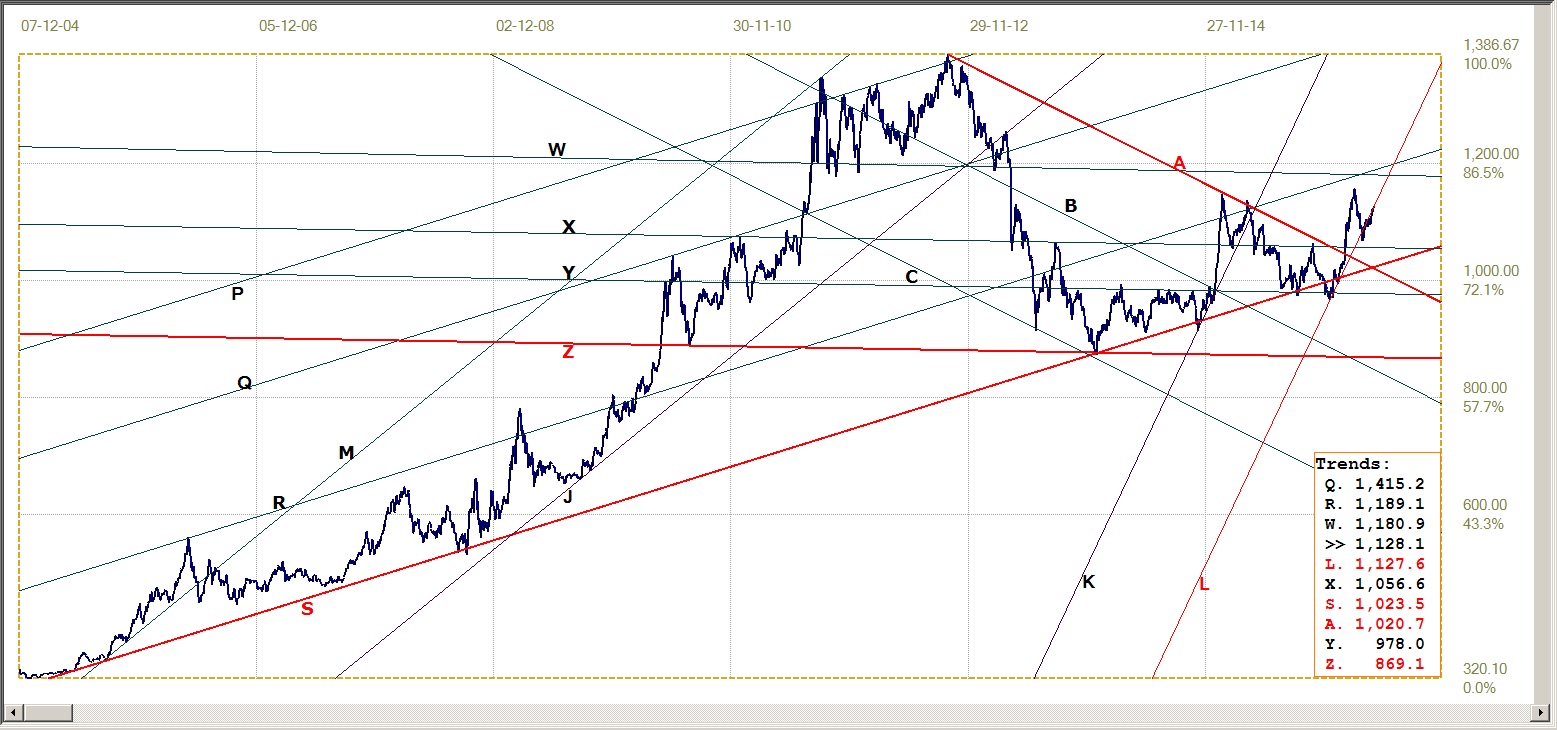
Euro gold price – PM fix in Euro, last = €1128.1 (www.kitco.com)
Despite the euro consolidating its recent gains against the dollar, the gold price has been doing enough to keep the euro price of gold at and just above the support of its own steep bull channel, KL (€1128), even though not with the same success as the dollar gold price maintained in its own bull channel. It has been a struggle for some time now, but the outlook remains positive provided there is no collapse away from the steep bull channel. First resistance is still some distance ahead.
Silver Daily Fix Chart
Silver is on of the few markets where there was a more significant change week on week. On Friday, the London fix came in at $17.31, or $0.54 below the fix ten days before, for a loss of close to 3%.
For a long time, it has been said here that silver appears to be the greater problem for the parties going short all the time. They used to attack the gold price with one waterfall attack after another, with silver then behaving the same in sympathy, as if that was their tactics to keep the pressure on silver. Over the past week, the price of gold has been much more resilient, holding firm and resuming the challenge on $1300 almost immediately after a raid.
This meant that attacks had to be launched directly on silver and from the price behaviour in Asian trading hours, selling of the physical on the SGE is being used as well, now that gold is being so stubborn. At least the price of silver, just like that of gold, is not in any immediate danger of breaking below its steep support along line L ($16.61), while the breaks above the earlier resistance at lines D($16.79) and M ($16.80) are also holding to keep the bull trend alive.
Silver daily fix, last = $17.31 (www.kitco.com)
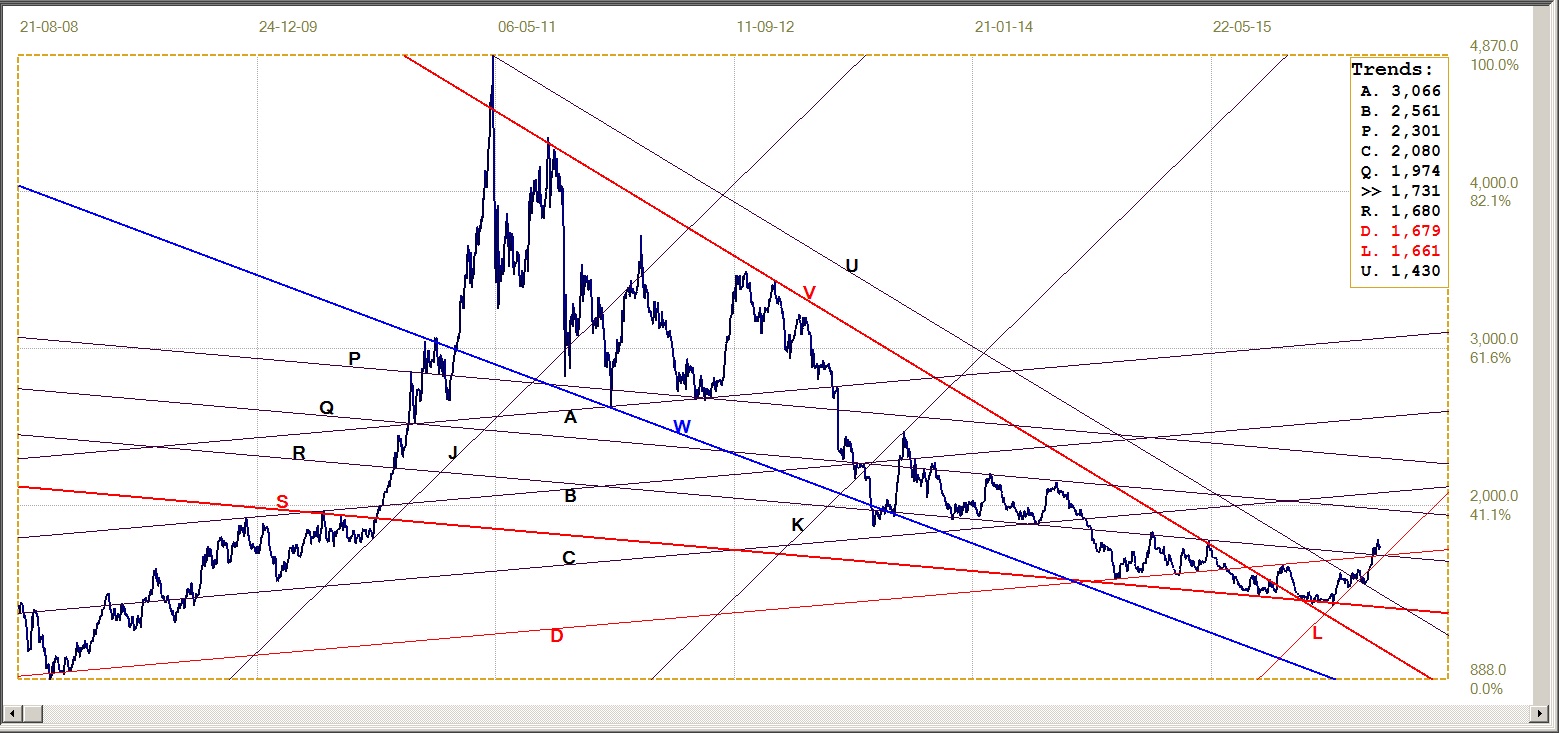
U.S. 10-year Treasury Note
The yield has extended its sideways trend below 2%, keeping mostly well below the 1.8% level, as if that has been set in place as a ceiling that would prevent too much profit taking. Line W, of bear channel UVW, has been shifted to the right as the price drifted sideways, to remain place as the possible boundary of the bear channel. The reason for moving the trend line is to find a position where the spacing of channel UVW fits one of the standard ratios as confirmation that line W is located correctly.
The ratio now is very close to the 382:618 of the Fibonacci ratio – the second most often seen on all kinds of charts, which adds confidence for now.
The yield started the week at 1.865%, but immediately recovered to below 1.8% to present a stable picture of the bond market. It has been reported there has been a good deal of foreign selling of US Treasuries, most likely sparked by the weak dollar of the past month or so, in particular against the yen; Japanese hold a good many US Treasuries in both the central bank and in private hands. It is the latter, who for quite a long time saw US assets as a hedge against a weaker yen, who started to take profit when the yen set off on a tear.
As with Wall Street, investors on Main Street view the long duration side of the Treasury market with close interest; that is where some of their pension and 401(k) funds find a home. Any sustained weakness can be expected to make them nervous about their financial future and nervous voters are the last thing the administration wants during an election year – which may explain the apparent 1.8% cap.
With so much of the Treasury issue in foreign hands, a desire to prevent any undue selling of Treasuries might also explain the focus of concern on the dollar-yen rate. Neither the US nor Japan wants increased selling of US assets that could add more pressure to the already weak dollar and pop the 10-year yield above 1.8% or even above the psychological 2% level.
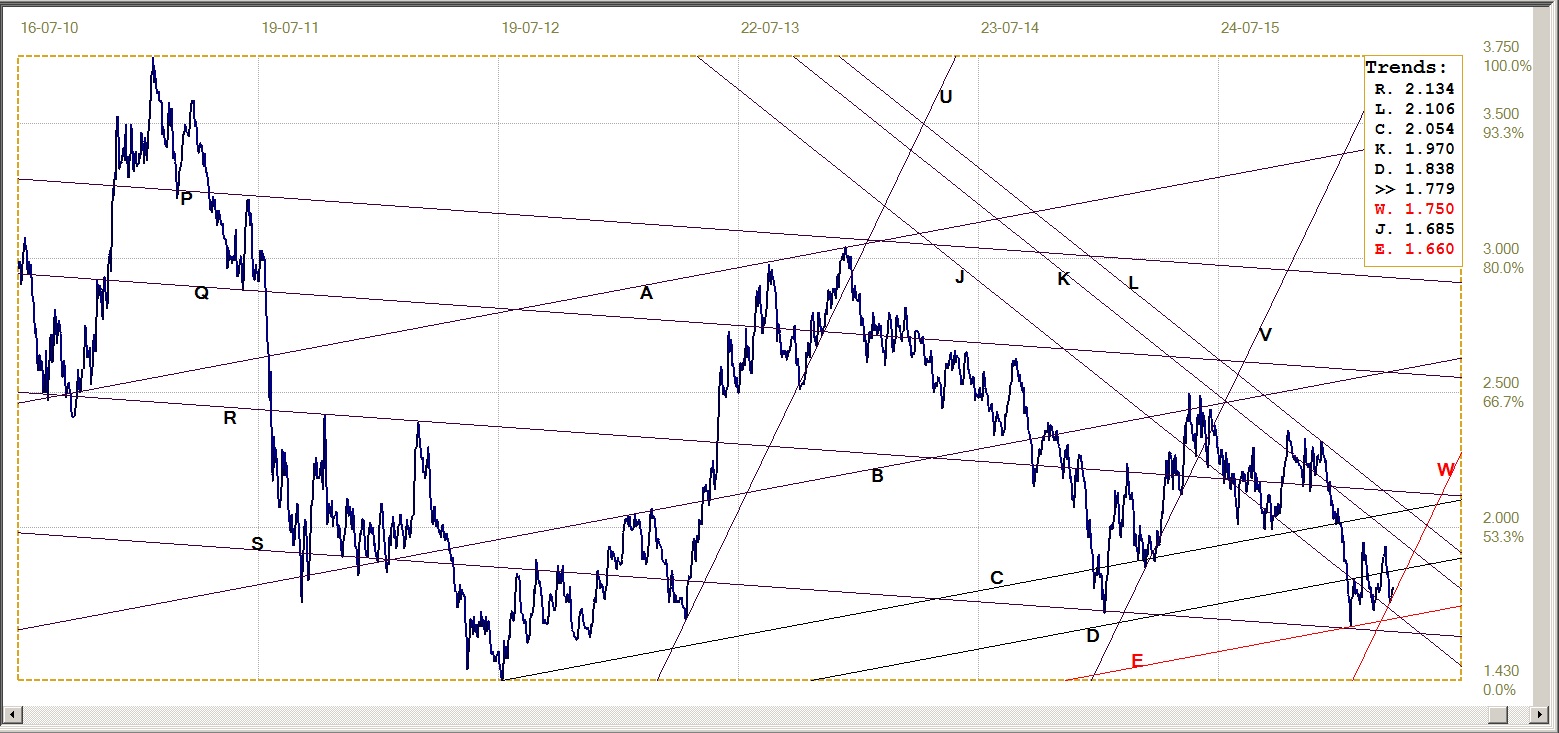
U.S. 10-year Treasury note, last = 1.779% (www.investing.com)
West Texas Intermediate crude. Daily close
The new bull trend in WTI crude is holding well to the steep support along line W ($41.42). The price bumped against resistance at line D (46.27) after breaking to above resistance at line T ($44.81), then retreated back just below line T.
So far, the price has not reacted to any significant degree to the extended fire close to the Canadian tar sand oil fields, that has interrupted the production of more than 500 000 barrels so far. This lack of response could be because there was news that US banks were working at restructuring the finance of shale oil producers in the US and that their production was picking up again. The previously observed connection between the price of crude and Wall Street is also now no longer as evident.
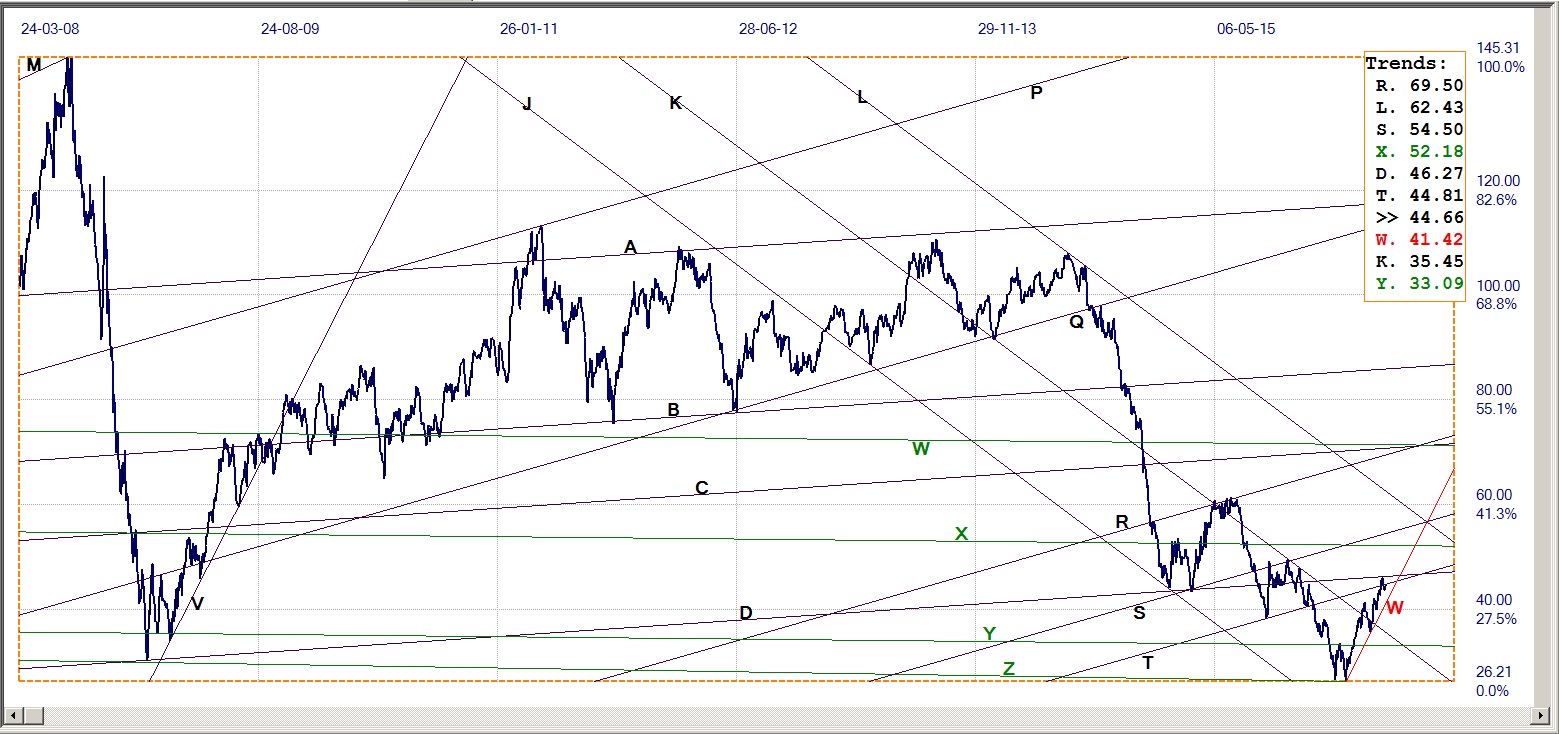
WTI crude – Daily close, last = $44.66 (Investing.com)
©2016 daan joubert, Rights Reserved
chartsym (at) gmail(dot)com
More from Gold-Eagle


