The Case For Lower US Dollar


Will Petro-Dollar System Hold?
The US dollar is still the world’s dominant reserve currency for global trades. The question is: will the petrodollar system continue to hold? The short answer is: yes in the near future, as there are no viable alternative at present. In our separate article, we demonstrated that the crude oil price (WITC) will start to go up this year, after crashing to a low of $26. If this is the case, then the US dollar will get lower, as they are highly correlated through the petrodollar system.
In this article, we present the results of our technical analysis of US dollar index (USD):
Forecast for USD: US dollar will start to decrease from current $93 and reach a low of $78 by end of 2016.
Traditional Analysis
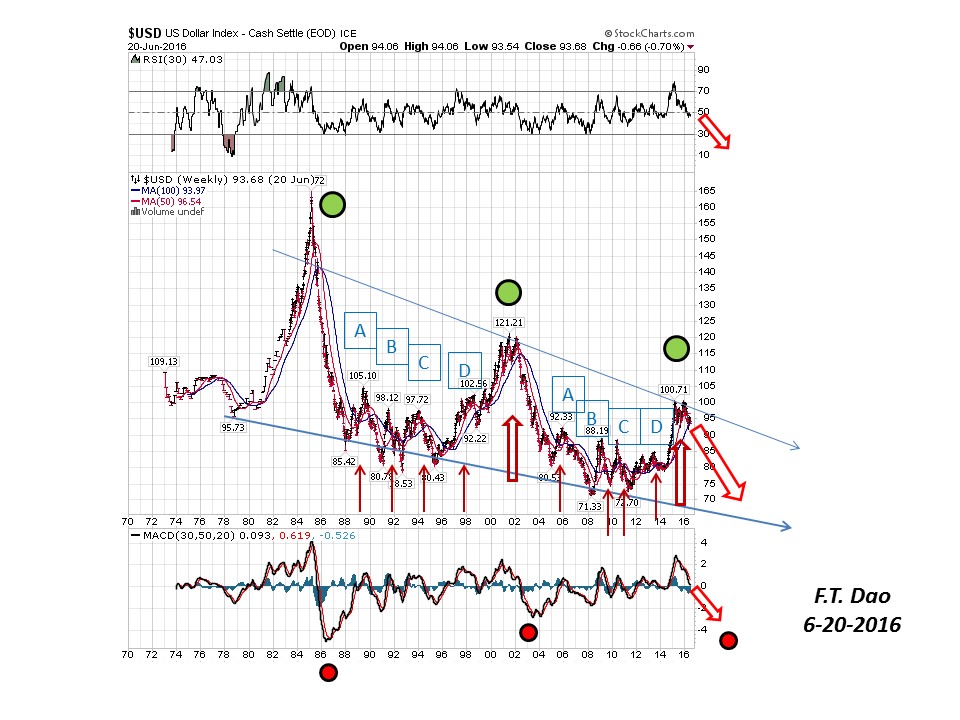
We start the technical analysis with a big picture, using simple trend lines and identifying similar fractal patterns in the long weekly data series. Note the similarity of two peak patterns, marked A, B, C, and D. The US dollar has been decreasing since 1974 and fluctuating between 2 blue trend lines. Furthermore, the latest RSI and MACD indicators both point to lower US dollar values.
Correlation Analysis
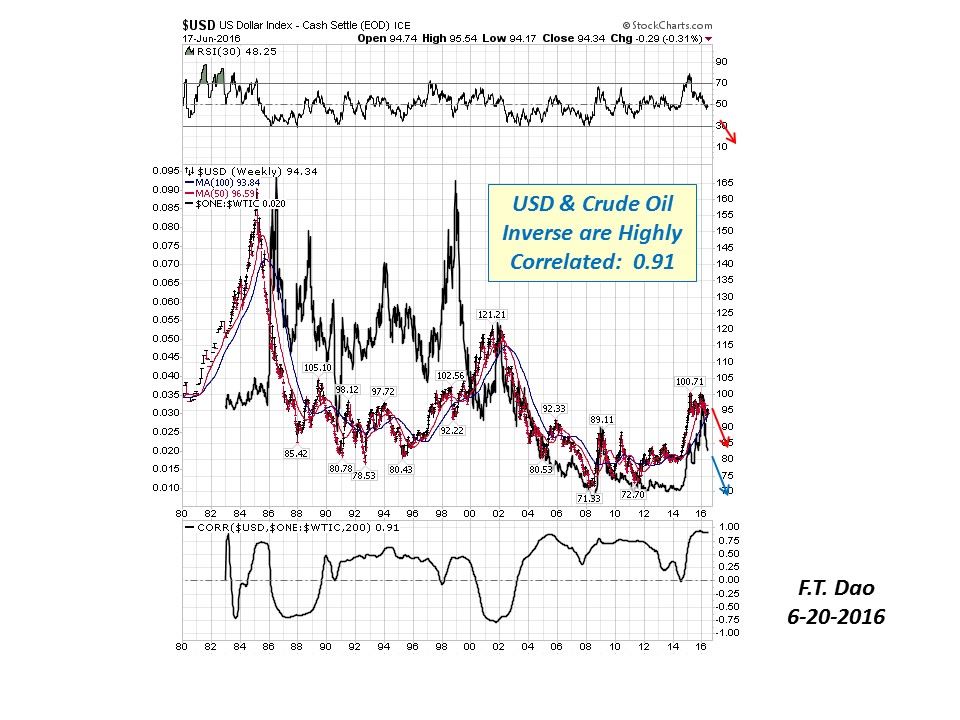
The correlation of US dollar with crude oil, commonly known as the petro-dollar system, is shown in the following chart:

As discussed in our earlier article, the inverse crude oil price is highly and positively correlated with the US dollar. The correlation coefficient is 0.91. That is the inverse crude oil moves in the same direction as the US dollar. The following table summarizes the correlation of US dollar with 3 assets.
This sample of correlations shows that US dollar is very likely to go down in values, as the associated assets exhibit same behavior in moving down. In particular, this is the case with gold, which we have projected to go up explosively this year. If gold goes up, gold inverse (1/gold price) will go down. By tight association with gold inverse, US dollar will go down too. With DOW, US dollar will go down also. Fundamentally, there has been too much printing by Fed, known as QE in the past few years. The DOW equity has been pumped up with massive liquidity of paper currency, and not by industrial organic growth. The massive amount of US dollars simply lifts up all tangible assets, with some assets more than the others.
Fourier Cycle Analysis
Our analysis of 40-years of monthly US dollar (USD) price data is shown in the following chart. The internal cycles thus determined allow us to forecast US dollar to 2020.
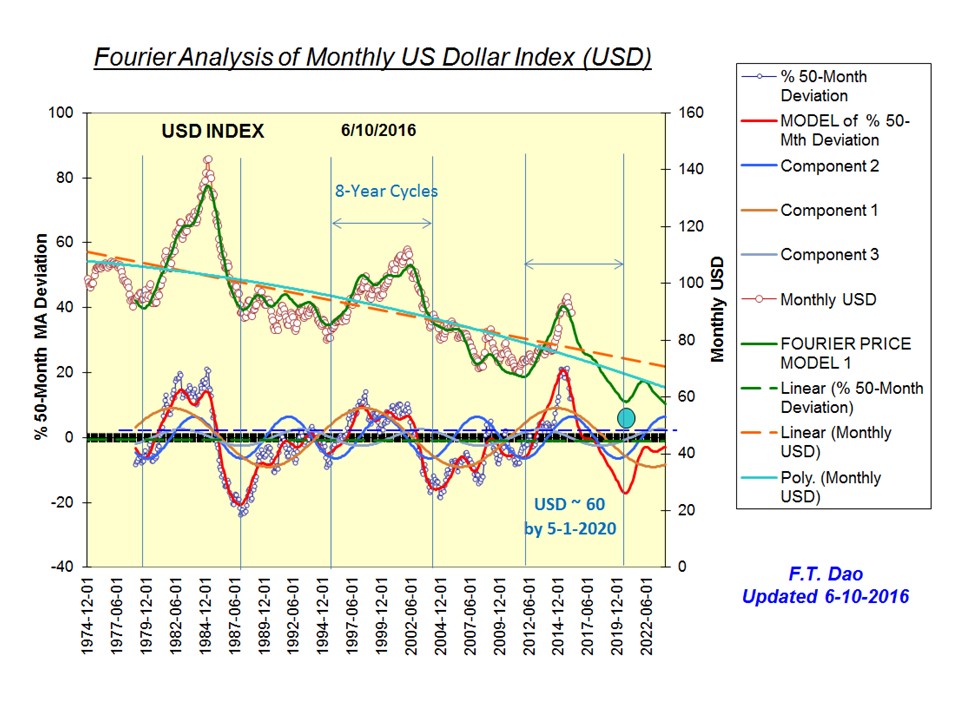
Our key analytical results are:
- The US dollar will decrease to $78 by end of 2016 and $60 by 2020.
- The 3 major internal cycles are: 16-year cycle, 8-year cycle and 10-year cycle.
Our experience with this type of analysis is that the internal cycles are not cast in concrete with time series. Nevertheless, we find that the major cycles are steady. For instance, if we cut the monthly data in half, the 8-year cycle remains a dominant cycle emerged from our smaller set of analysis. Another note: we firmly believe that the derived internal cycles account for all the behavior of the investors and traders as an aggregate.
Daily Analysis of UUP
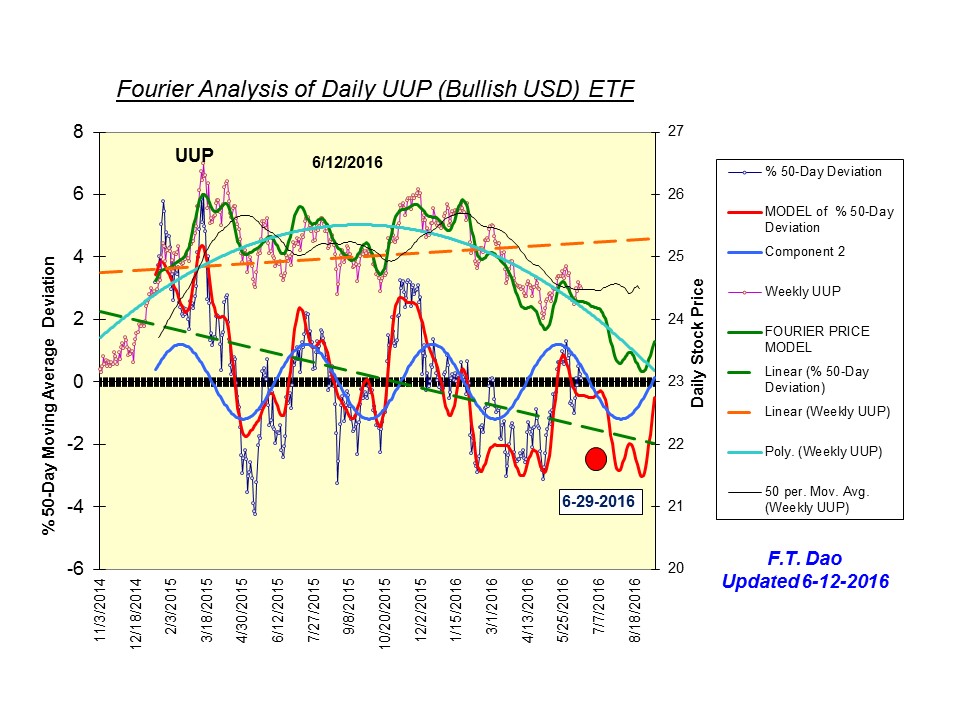
In response to some reader’s interest and request for short term cycle analysis, we include a daily analysis of the popular trader US dollar bullish ETF “UUP”. Again our analysis shows a downward movement in the price of US dollar, consistent with the big picture above.
Summary
While there may be fluctuation on the short term level, the general US dollar is heading down this year and beyond. We are not professional fund managers. Do your own research and consult financial managers for investment advice and help regarding currency trading and investments.


