Catching The Big Waves Of 2016


“What has been will be again, what has been done will be done again;
there is nothing new under the sun.“ Ecclesiastes 1:9
There are recently several articles published in this website as to why the precious metals should rise to new heights. We present here a special technical analysis and show when the next big wave of the gold stocks will explode upwards and how high their prices will reach. The results and charts are presented here using a special technical analysis with the following assumptions:
- The behavior of the investors will repeat in time as best depicted in a set of cycles, characteristic of a given market. That is, the investor nature of greed and fear lends itself to a technical analysis based on a form of Fourier transformation.
- The complex cycle set underlying the stock price always return to the mean as an aggregate. We use the percent deviation of the current price from the moving average of the past prices as a key parameter.
In this article we have applied our analysis to determine the big waves in 2016. The long time series of monthly were used for computation purpose. The weekly data and different time periods were used as validity checks to confirm these big waves.
The Big Waves Summary
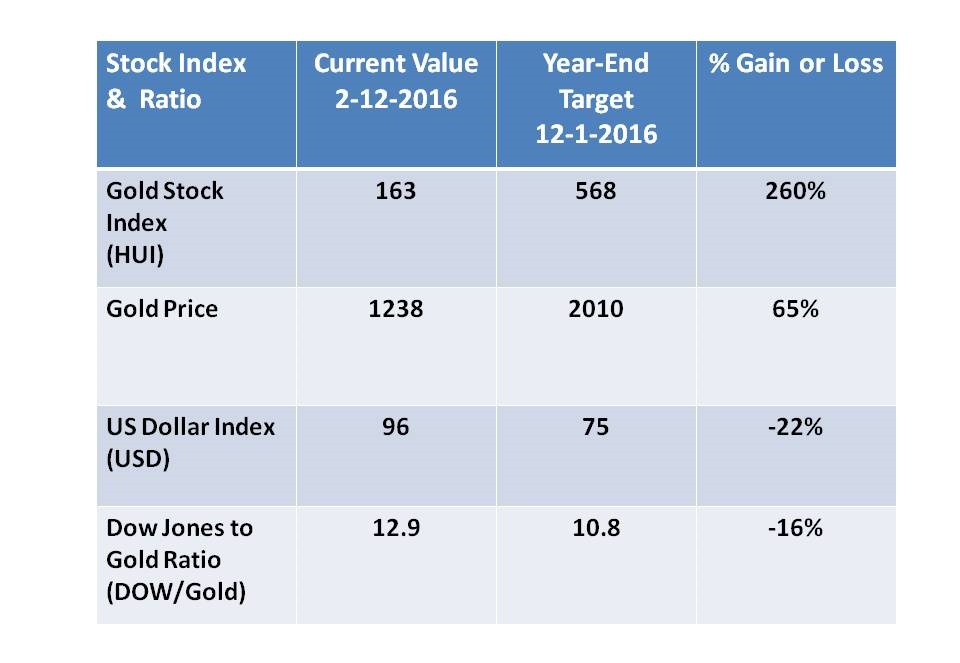
Our analysis showed that the big wave of gold price has started and the gold price will reach $2010 level by year end from the current level of $1238. The rise will continue in 2017. By comparison the gold stock index (HUI) will rise faster by more than 3 times. The results of our preliminary analysis are presented in the following table.
Highlights of Analysis:
Gold Stock (HUI) Index
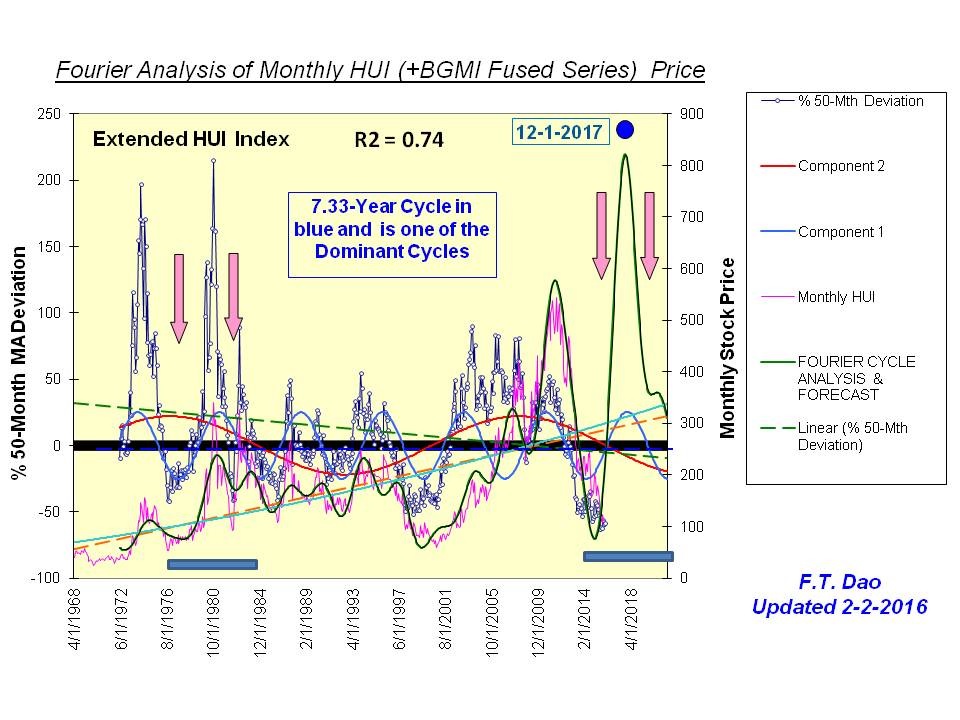
We used gold bugs index (HUI) with a rescaled Baron’s gold mining prices (BGMI) for this study. The data set is from 1968 to current 2016. We included the 1970-1980 gold price data to show the similarity in the pattern of stock rise. Our analysis showed:
- The rise of 2016 peak in gold stocks will be explosive, similar to the 1980 peak as shown in the chart 1. Note there are 2 dominant cycles for the gold stock index. The similarity of the 1980 peak and the forecast 2016 peak is evident in the chart.
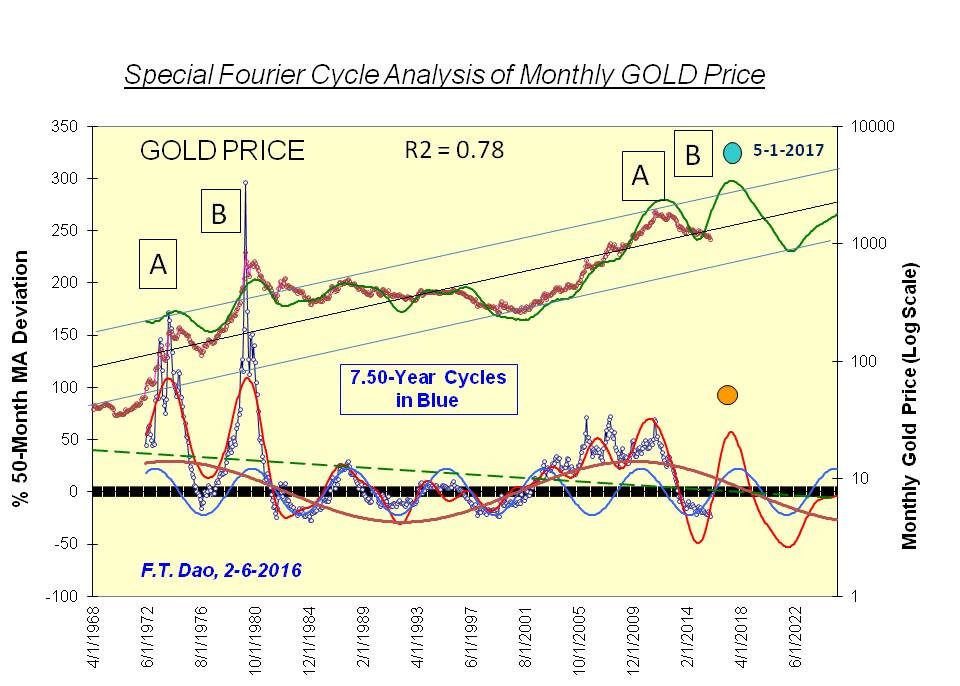
- A similar pattern will hold for the gold price peaks.
Of course, the explosive rise will come with high volatility. The issue of rewards versus risk will not be treated in this article. This issue and the related issue regarding the portfolio rebalancing by incorporating the forecasting capability is under development.
USD Dollar Index
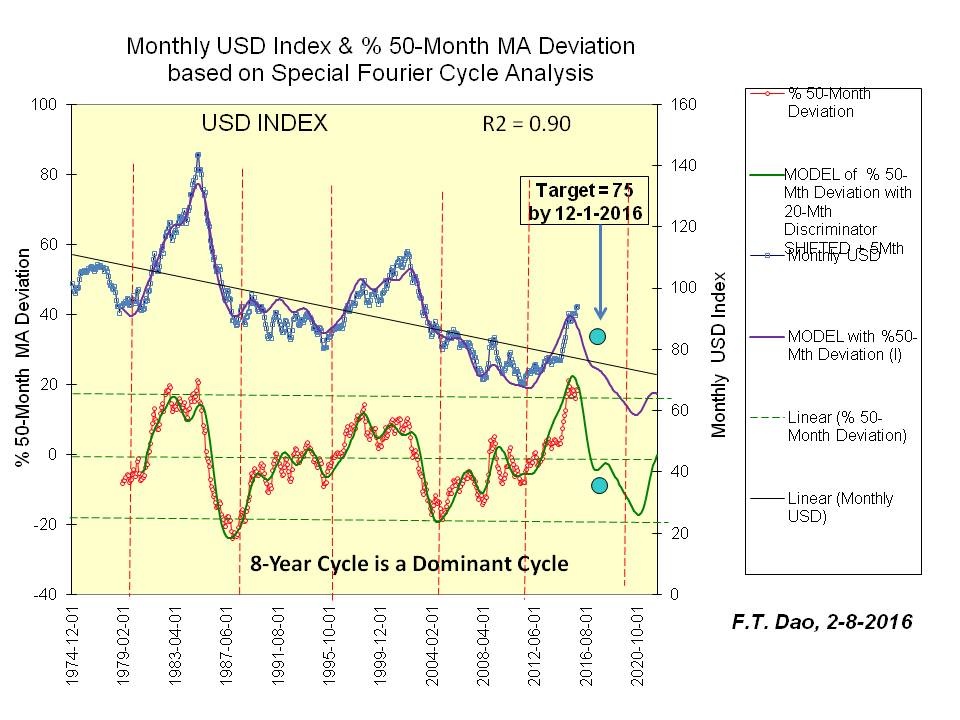
The USD index has reached its top and will start to decline. While the decline is not unexpected, the decline will be significant from the current high value of 96 to 75 by the end of 2016. Note the dominant 8 year cycle marked with dotted lines in the chart. Compare this cycle with those of the gold and gold stocks.
- There are usually 2 or more dominant cycles underlying any stock prices. The 7 to 8 year cycle seem to be common among various markets for this long time period.
- The USD and HUI analyses showed the general counter correlation as expected.
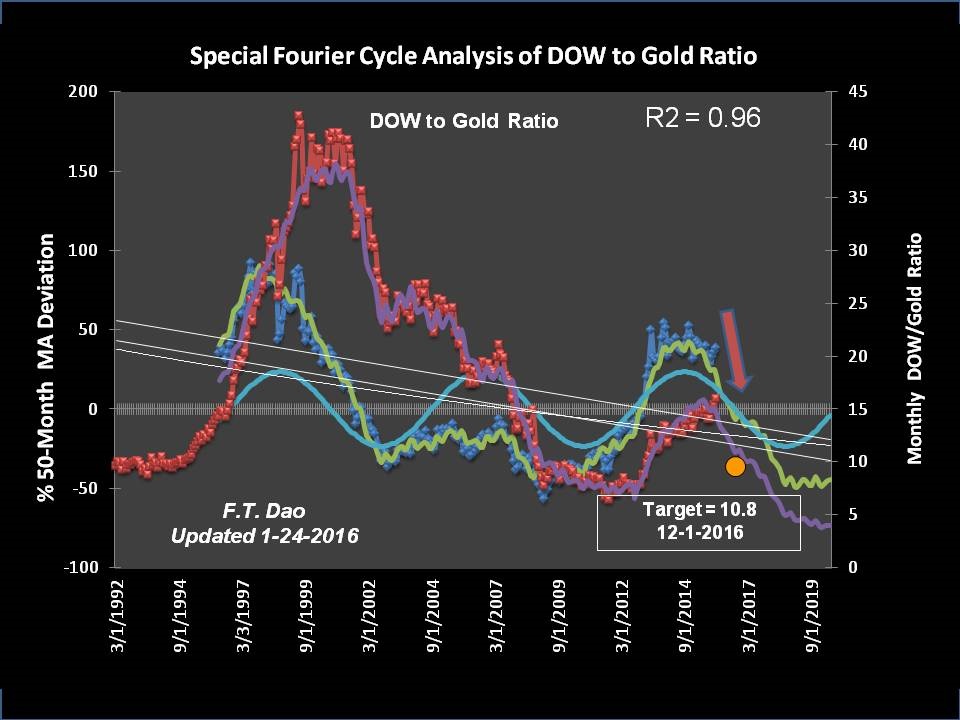
DOW/Gold Ratio
For investment purpose, we study the ratio of Dow Jones equity index to gold price for a shorter time frame. Our analysis showed that gold will outperform the equity market in 2016.
- The ratio DOW/Gold has reached its top and will decline quickly 16% by the end of 2016. This is a large decline rate for one year.
- The Dow Jones index has recently declined while the gold price has started to rise. The decline of the ratio (DOW/Gold) will last in several years beyond 2016.
The Next Step
The inevitable big waves presented here and the recent events of global financial turmoil make investment more challenging than before. In a way, the recent discussion of negative interest rates by Fed chair Yellen at the Congress hearing confirms the explosive upward wave of the gold stocks. This will require more accurate market forecast in the portfolio management and timely portfolio rebalancing. This is our work in progress.


