The Chart That Signaled The Bottom


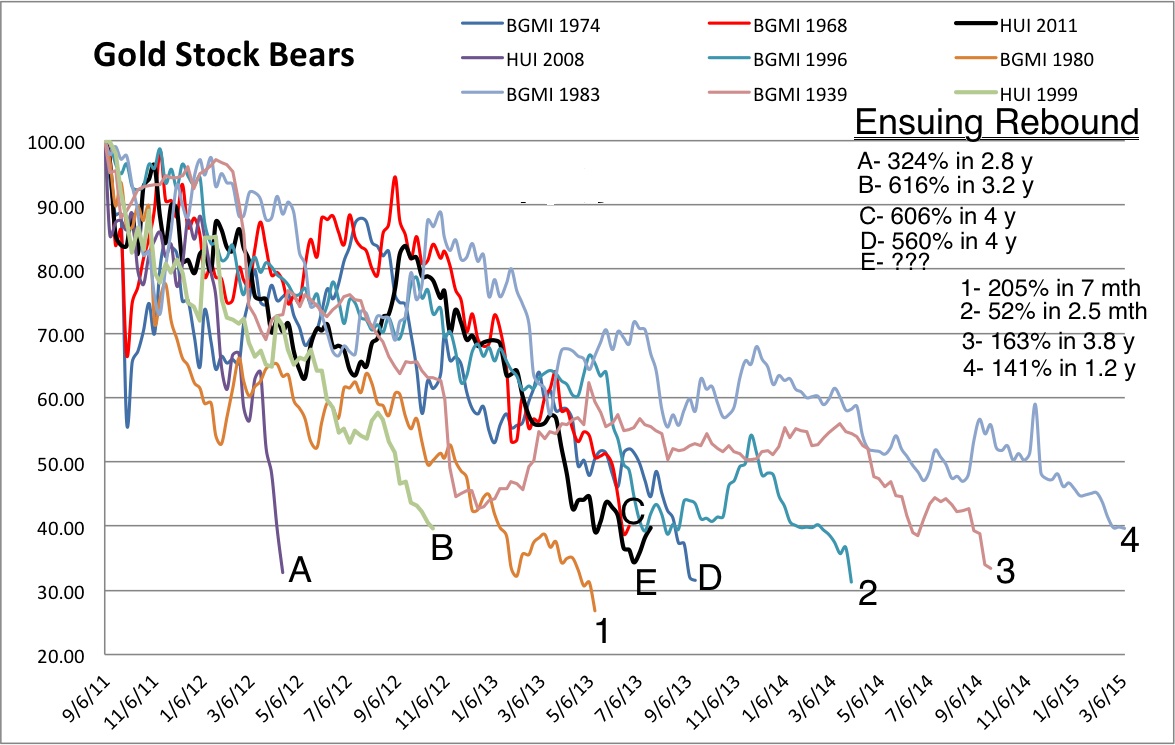
Some readers may be sick of seeing this chart but I believe there is no more important chart when assessing or describing the current market (in gold stocks). From a weekly price perspective the recent bear market labeled E finished down 65%. It was almost identical in trajectory, time and price to C, the 1968-1970 bear market and fairly close to D, the 1974-1976 bear market. Both of those bear markets were followed by tremendous advances which took the 1960-1980 secular bull market to new all-time highs. Simply put, by itself this almost bulletproof evidence of a major bottom and likelihood of major gains directly ahead.
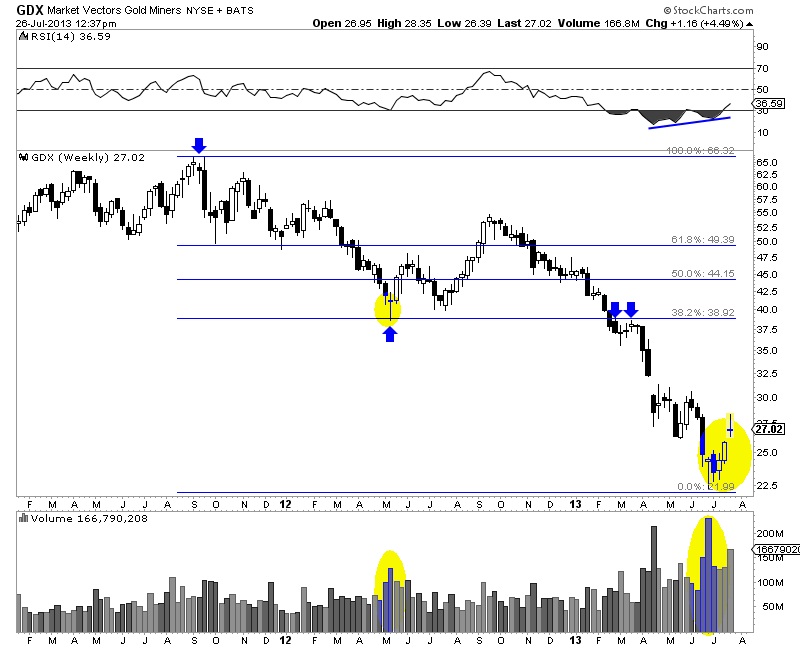
GDX bottomed at $22 which was a very strong Fibonacci target. The target was connected to the 2011 top and the 2012 top which also marked the start of the breakdown in the spring. When GDX reached this target it formed a bullish hammer and on record volume. That was followed by two weeks of testing the low. Since then the market has moved higher, thus confirming the reversal and the bottom.
Now that a major bottom is likely in, we should turn our attention to what history tells us about major recoveries. Below is a chart we constructed by using the data from recoveries in 1970, 1976, 2000 and 2008. We weighed those recoveries equally, combined them into one and put the result on a chart with 216 (HUI weekly bottom) as the starting spot. The result is below.

The recovery template, as we call it, argues for a 57% rebound in about four months and a 79% rebound in seven months. Yet, notice the circle at the start? There is where the recovery corrects or consolidates around the 50-day moving average. Those who missed the initial pop could use the correction or consolidation to capitalize on the next and much larger leg higher.
The bottom line is if we do see a correction or consolidation, don’t let it frighten you or cause you to question the major bottom. History argues that it is an excellent buying opportunity. Again, use the 50-day MA as your guide. The market can begin its next leg higher when it is trading above a 50-day MA that has started to curl up.
Jordan Roy-Byrne, CMT

Jordan Roy-Byrne, CMT is a Chartered Market Technician and member of the Market Technicians Association. He is the publisher and editor of TheDailyGold Premium, a publication which emphasizes market timing and stock selection, as well as TheDailyGold Global, an add-on service for subscribers which covers global capital markets. He is also the author of the 2015 book, The Coming Renewal of Gold’s Secular Bull Market which is available for free. TheDailyGold.com was recently named one of the top 50 Investment Blogs by DailyReckoning and WalletHub.


