China Shanghai Composite Update


The Chinese stock market is of interest to us not because we necessarily want to trade it, but because of its effect on other world markets. Its heavy drop on Monday morning contributed to the rout on Wall St later in the day. The Chinese economy is a massive Ponzi scheme that is threatening to implode, with grave implications for the world economy.
A common misconception about China is that the market can't drop too much because the Chinese government and Treasury has a huge budget surplus which it can use to wade in and prop up the market, either directly or indirectly. Veteran top bubble expert Doug Noland, of the Credit Bubble Bulletin, succinctly illuminates the stark reality of the situation as follows -
"According to SNL Financial, Chinese banks now hold four of the top five spots on the list of the world's largest banks. Pulling data from year-end 2014 balance sheets, the big four Chinese banks - Industrial & Commercial Bank of China, China Construction Bank, Agricultural Bank of China and Bank of China - ended 2014 with assets of 87.59 TN yuan, or $13.7 TN. China's big four saw combined Total Assets expand 64% in four years, with Loans up 80%. Estimates place total China banking system assets at $172 TN yuan to end 2014, or about $27 TN at today's exchange rate. Since the end of 2008, banking assets have swelled 175%. Estimates show "shadow banking" assets having ballooned to the neighborhood of $5.0 TN. A bursting Chinese Super Bubble is a systemic issue - for the global economy, for global markets and for global finance. Rather quickly, China's $3.7 TN international reserve position doesn't seem as all-powerful." This makes it clear that, despite its apparently huge reserves, China’s economy is a lot more vulnerable than many think.
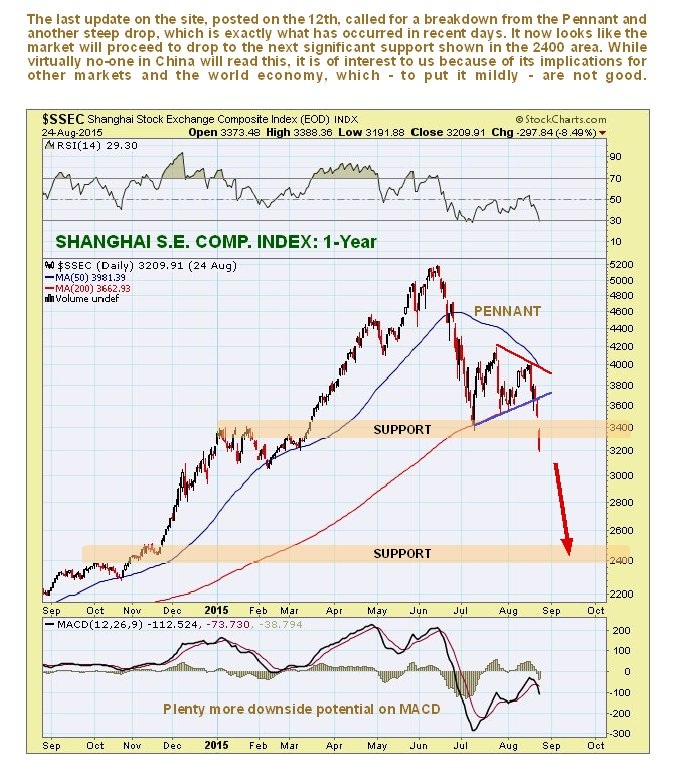
The last update on China was posted on the site on the 12th, when the Shanghai Composite index had rallied up to the top boundary of the bear Pennant that we had correctly identified. That update called for the market to break down from this Pennant and below its rising 200-day moving average and proceed to drop hard. That is what has since happened as we know, and the purpose of this update is to delineate a probable downside target for the market for this down-leg.
On the latest 1-year chart for the Shanghai Composite index, we can see that it has broken down from the Pennant and dropped steeply, crashing through the support level shown. While there is a lesser support level in the 3050 area, it is now expected to continue to drop fairly steeply, over the next several months and possibly within weeks, to the next important support level at and above about 2400.
Anyone looking for fundamental justification for further losses might want to reflect on the fact that the average PE ratio for the Chinese stock market is a lofty 61 – those long the market had therefore better hope it doesn’t decide to overshoot to the downside.
The Chinese market actually performs very well technically, which is probably due to the naivety of most participants in this market, and that includes the government. This is partly why we were able to call the June – July crash before it happened, admittedly a little ahead of the final high, the bounce to the 4000 area from mega-oversold in July, and then the breakdown from the Pennant leading to the latest sharp drop.
********
Courtesy of http://www.clivemaund.com

Clive P. Maund’s interest in markets started when, as an aimless youth searching for direction in his mid-20’s, he inherited some money. Unfortunately it was not enough to live a utopian lifestyle as a playboy or retire very young. Therefore on the advice of his brother, he bought a load of British Petroleum stock, which promptly went up 20% in the space of a few weeks. Clive sold them at the top…which really fired his imagination. The prospect of being able to buy securities and sell them later at a higher price, and make money for doing little or no work was most attractive – and so the quest began, especially as he had been further stoked up by watching from the sidelines with a mixture of fascination and envy as fortunes were made in the roaring gold and silver bull market of the late 70’s.
Clive furthered his education in Technical Analysis or charting by ordering various good books from the US and by applying what he learned at work on an everyday basis. He also obtained the UK Society of Technical Analysts’ Diploma.
The years following 2005 saw the boom phase of the Gold and Silver bull market, until they peaked in late 2011. While there is ongoing debate about whether that was the final high, it is not believed to be because of the continuing global debasement of fiat currency. The bear market since 2011 is viewed as being very similar to the 2-year reaction in the mid-70’s, which was preceded by a powerful advance and was followed by a gigantic parabolic price ramp. Moreover, Precious Metals should come back into their own when the various asset bubbles elsewhere burst, which looks set to happen anytime soon.
Visit Clive at his website: CliveMaund.com


