China Teeters & Gold Pushes Higher


China FXI (Stock Market Proxy ETF) Chart
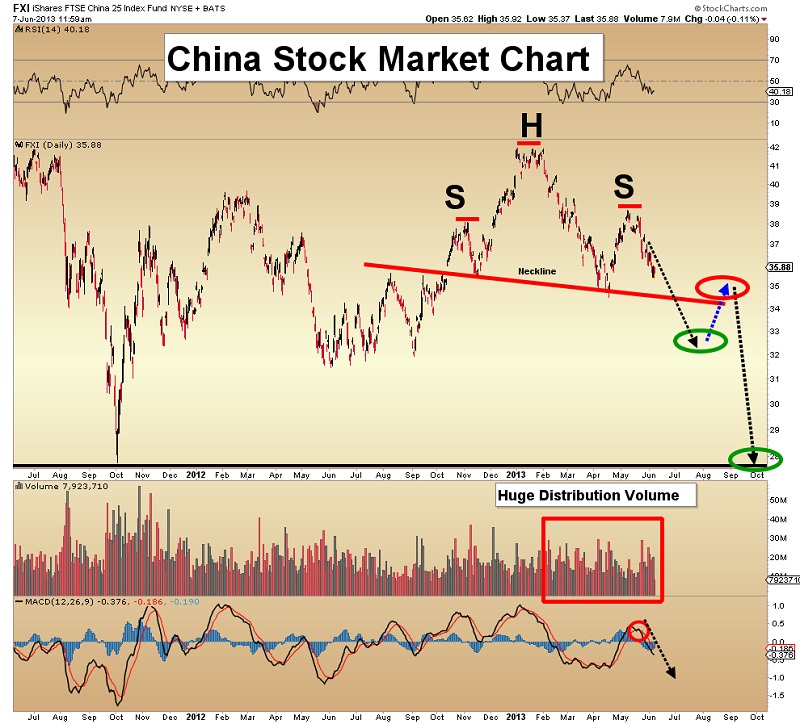
• China is the world's second largest economy, and the fastest growing major one. They are also the biggest exporter, and the second largest importer.
• China overtook America in 2010, and became the world’s largest manufacturing nation. This Chinese stock market chart could be called a thermometer of the health of global manufacturing.
• There is a head and shoulders top in play, which could be foreshadowing a global recession. While nothing is confirmed unless the neckline breaks (at about $34), investors should keep a close eye on it.
• A recession could prompt more monetary stimulus, and boost gold prices.
Dow Topping Process Chart

• It’s possible that the top pattern in place on the Chinese stock market is a leading indicator of what is coming to America. Note the enormous distribution volume occurring on this chart.
• In the short term, the slow Stokes and CCI suggest that the Dow could rally a bit, but I think that if the 50 day moving average breaks, a decline down to 14,400 is likely.
• From there, I’m projecting a rally to about 15,000, followed by a bigger drop to the 13,800 area.
Gold Channel Chart

• This weekly chart shows gold trading in a channel, and it is extremely oversold. Note the position of the RSI oscillator, at the top of the chart. It’s now in a rising trend above 30, after reaching the lowest point in the history of this chart.
• Even if the current rally failed, there’s good support between $1227 -$1260. I’ve highlighted that with a thick blue line.
• The position of the oscillators suggests that gold could rally to the red channel line, which currently sits at about $1580.
Gold Summer Rally Chart
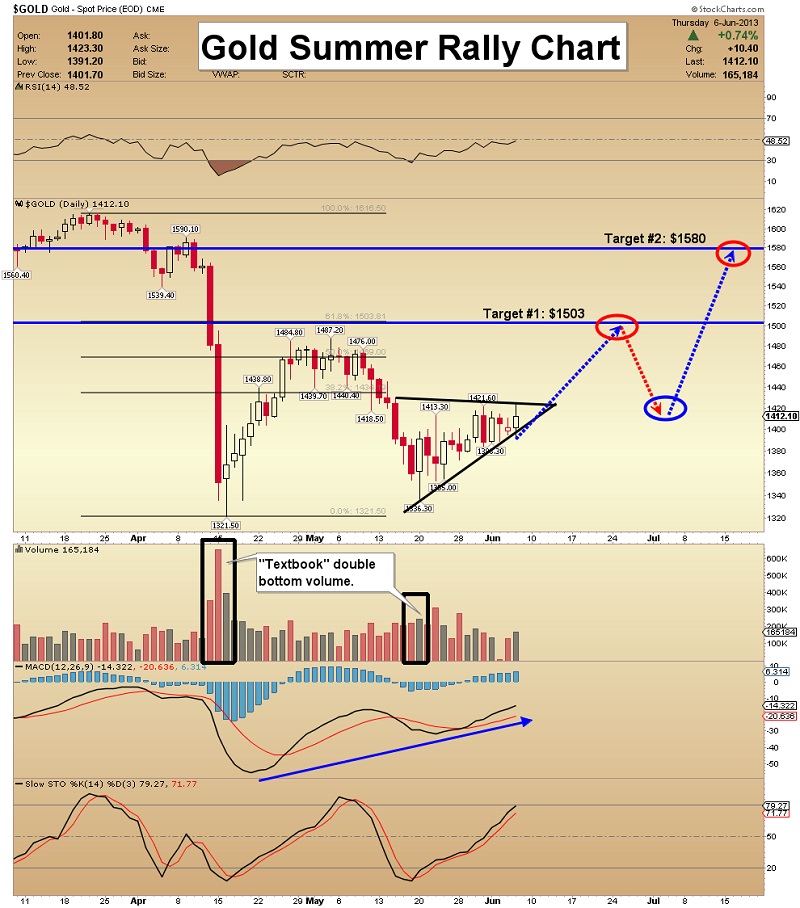
• The road to $1580, if it happens at all, may not be a smooth ride. There is strong Fibonacci resistance at about $1503.
• I want to see two consecutive closes above $1421.60 before I’ll be confident that gold can get to $1503.
• The good news is that MACD and RSI indicators are both predicting higher prices.
• The low volume demonstrates a lack of confidence in any such rally, but this chart doesn’t show any of the substantial physical gold buying taking place in Asia.
GDX Power Volume Chart
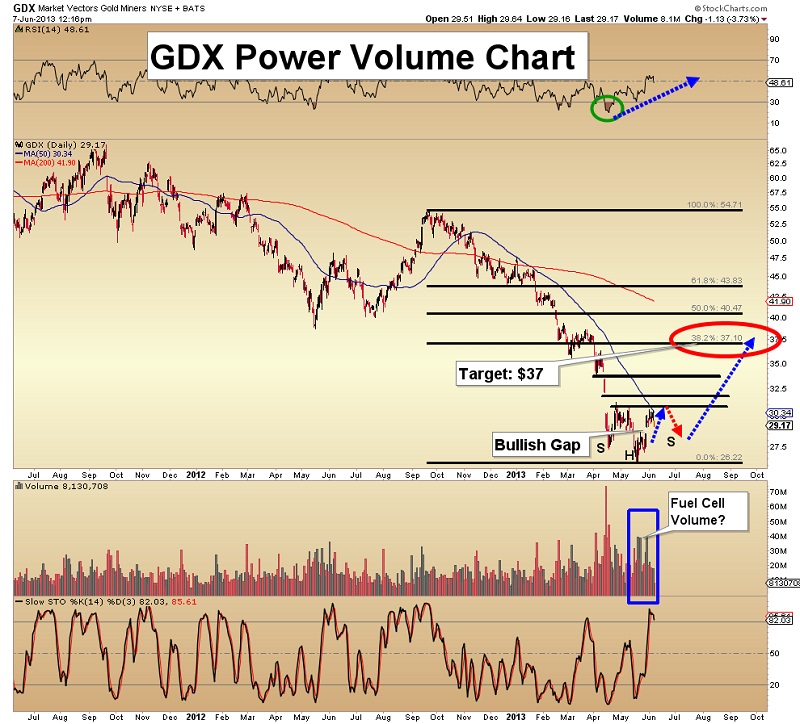
• The bullish gap that occurred on strong volume about a week ago has not been filled, but GDX is struggling to trade above $30.50.
• Over the past two weeks, there has been good volume in the senior and intermediate gold stocks, and consistent rallies into the close. It’s always a positive to see closing numbers well off the lows for the day,creating long-tailed candlesticks on the chart.
• Obviously, I’d prefer to see gold stocks rally every day (!), but that’s not realistic. A pullback to the $28 area would fill the gap, and set up an inverse h & s bottom formation.
GDX Short Term Chart

• The short term technical picture is also improving. Note the inverse head and shoulders formation on this 60 minute chart. There’s also an irregular cup & handle pattern.
• This chart also clearly shows the price is hesitating in the $30.50 area
• An upside breakout would occur at about $30.75, with a target of $35- $36.
GDXJ Trendline Breakout Chart
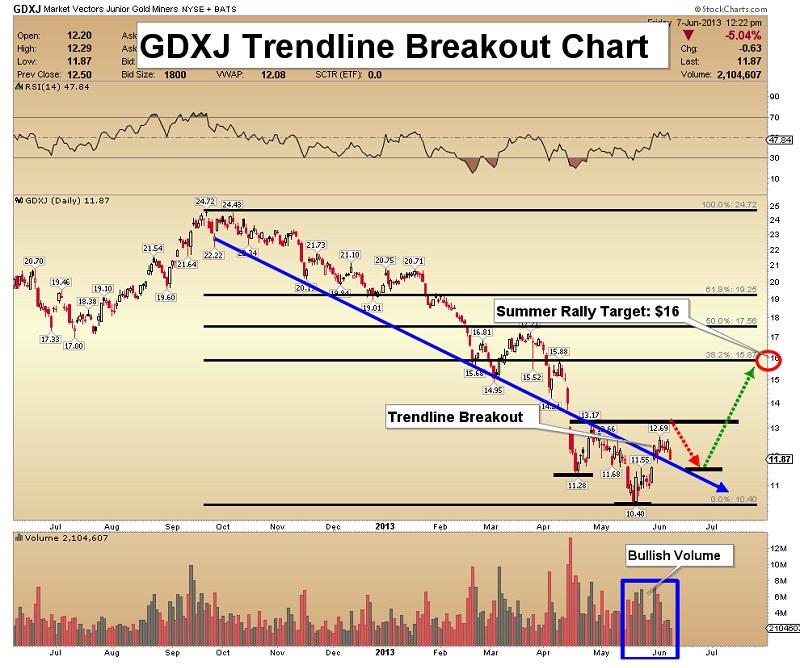
• Over the past week, the downchannel has been convincingly taken out, on pretty good volume.
• Volume has decreased over the past few days, while GDXJ has just drifted sideways, and that’s technically bullish.
• A summer rally could see GDXJ rise to about $16.
Silver COT Report Chart
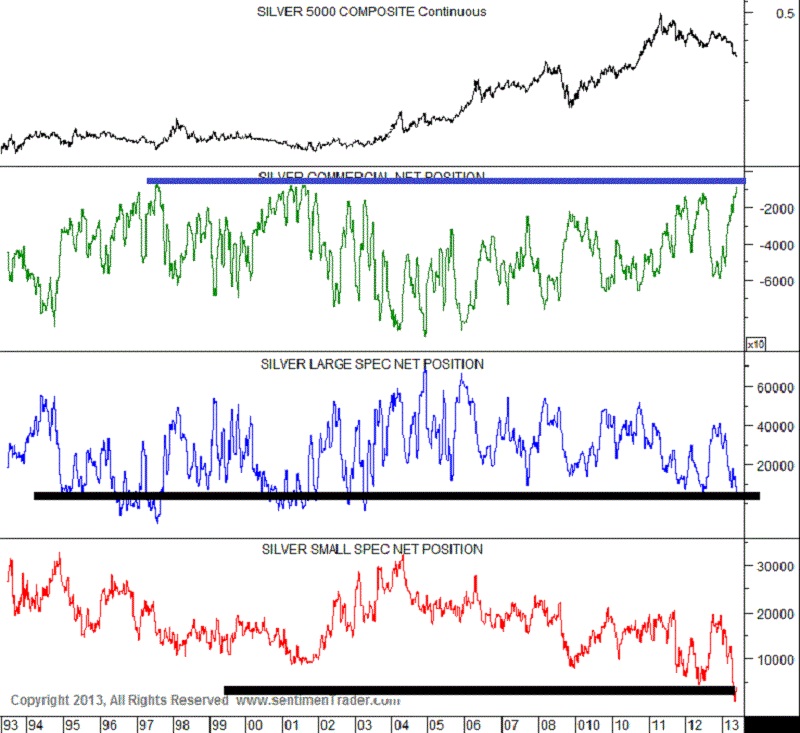
• Based on this sentimentrader.com chart, commercial traders are now about as bullish as they were way back in the year 2001.
• The public is extremely bearish, and so are hedge funds.
• Silver is much more volatile than gold, so investors need to be comfortable with large drawdowns. I wouldn’t waste much time trying to call the exact bottom. I like buying modest amounts of silver on $5 drops, and storing it outside the banking system!
![]()
Unique Introduction For Gold-Eagle Readers: Send me an email to [email protected] and I'll send you 3 of my next Super Force Surge Signals, as I send them to paid subscribers, to you for free. Thank-you!
Stay alert for our Super Force alerts, sent by email to subscribers, for both the daily charts on Super Force Signals at www.superforcesignals.com and for the 60 minute charts at www.superforce60.com
About Super Force Signals:
Our Super Force signals are created thru our proprietary blend of the highest quality technical analysis and many years of successful business building. We are two business owners with excellent synergy. We understand risk and reward. Our subscribers are generally successful business owners, people like yourself with speculative funds, looking for serious management of your risk and reward in the market.
Frank Johnson: Executive Editor, Macro Risk Manager.
Morris Hubbartt: Chief Market Analyst, Trading Risk Specialist.
Super Force Signals
422 Richards Street
Vancouver, BC V6B 2Z4
Canada


