The Chinese Emperor Has No Clothes


 The first chart below may be signalling a very significant technical development from the perspective of global investor confidence.
The lower low in the On Balance Volume (OBV) chart is not yet significant in terms of extent; nevertheless, its significance lies in the fact that it is pointing to the “potential” emergence of a wave of selling pressure in the equity market of a country that has clearly been cooking its economic books (see evidence below).
Importantly, whilst the price of the Shanghai Index has been in a rising trend since the Chinese Central Authorities stepped in a couple of weeks ago, OBV has been in a falling trend. What this implies is that Central Authority support has pushed up prices on relatively small volumes and then sellers have come in and taken advantage of the higher prices to sell in larger accompanying volumes – which knocks back the index price again. One implication is that there may be a wall of selling volume building behind the Chinese Government’s hastily constructed dyke. The primary assumption that underlies OBV theory is that “price follows volume”.
The chart below shows that a break below 2900 could result in panic selling because the “theoretical” downside target is (roughly) 5100-3300 = an 1800 point fall from 3300; = a theoretical target of 1500
In terms of the longer term chart below, a theoretical target of 1500 is not outside the bounds of possibility. Should it happen it will evidence the fact that the Chinese economy has not been growing at the rate that the authorities would have had the world believe.
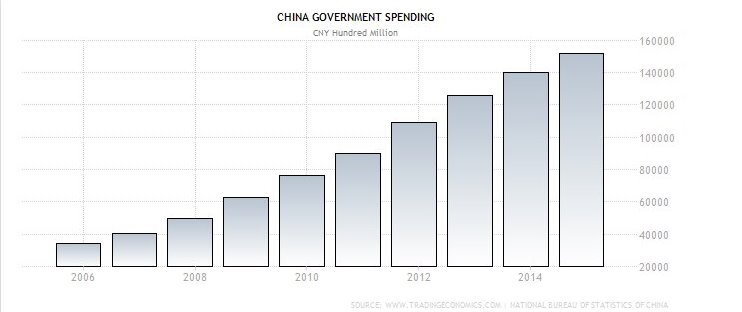
The chart below (source http://www.tradingeconomics.com/china/government-spending ) shows that Chinese government spending was 151,662 hundred million Yuan in 2014.
At current exchange rate of 1CNY:US$0.16, this translates to US$2.4 trillion.
The chart below (source: http://www.tradingeconomics.com/china/gdp ) shows that China’s GDP in 2014 was $10.36 trillion.
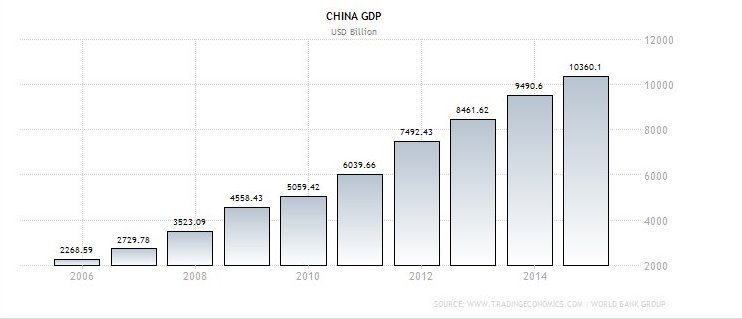
It follows that Chinese Government spending therefore accounted for 2.4/10.36 = 23% of China’s entire GDP in 2014. Therefore, it is neither a misrepresentation nor an exaggeration to say that China has been “cooking its economic books”.
When investors across the planet begin to focus on the practical implications of this fact it will almost certainly have a negative impact on investor sentiment. Where will global economic growth come from, if not from China? The US? Europe? Japan? India? (It should be borne in mind that, as a general statement, the BRICS economies are all dependent on China as a major customer)
Whilst the US unemployment rate is hitting lows, it is arguably a statistical sleight of hand in a sophisticated game of “find the pea under the correct walnut shell”. The adjusted unemployment number is around 7.5% if one takes into account the number of people who have departed the workforce because they had become terminally unemployed.
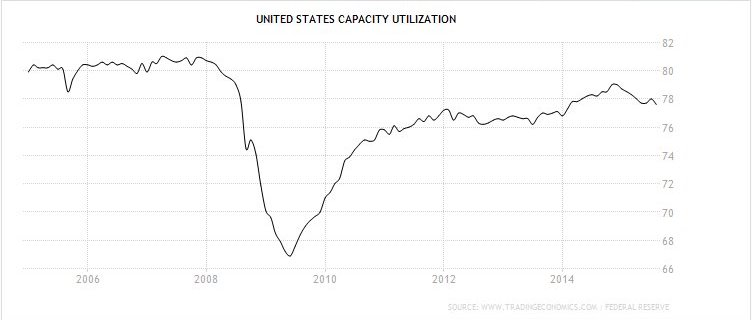
Also, it should be noted from the following chart that US capacity utilisation appears to have peaked at a level that is below the 2008 peak (http://www.tradingeconomics.com/united-states/capacity-utilization )
Whilst the chart below shows that the German DAX index has certainly been strong, there are two inhibiting factors:
- Around 45% of Germany’s GDP is made up of exports
- Germany’s GDP in 2014 was around US$7 trillion and the German tail by itself is not large enough to wag the global economic dog
Finally, the following are the next four largest economies after the US and China:
Note: Relative, to the above, the Indian economy is small. Its GDP in 2014 was around $2 trillion, so let’s keep focussed on the above three economies other than Germany. Of course, a country’s share market may be used as a proxy for what investors expect to emerge in the underlying economy
Japan has an ageing population and Abenomics has not had a sufficient impact to bring Japan back to the status of “economic powerhouse” – as evidenced by the fact that the Nikkei is trading at roughly half its pre 2000 peak.
The UK’s FTSE Index appears to be retreating from a “triple top” and it has recently given technical sell signals
France’s CAC index has shown declining tops since its peak in 2000
Overall Conclusion
Given the emerging realisation that the Chinese Emperor has no clothes, and given the lacklustre performance of the Japanese, French and UK markets, and given that Germany’s economy is heavily dependent on exports, where will the growth come from?
Author note: The exponential growth in revenue-flows generated by so-called Artificial Intelligence products/services will undoubtedly contribute significantly to future global economic stability – after the overhang of Global Sovereign Debt has worked its way through the system. In this latter regard, the technical evidence is mounting that the global financial markets are pointing to a period of economic activity that will be characterized by deflationary headwinds as the Global Financial Crisis grinds inexorably to its culminating “washout” point. Logic dictates that this washout point will be accompanied by a final realizations that a) the legacy system of so-called “democratic” government – whereby elected political candidates are nominated by vested interests – has passed its use-by date; and b) that the legacy system of Central Banking has become impotent as an economic regulator. The longer we dilly dally in rationalizing this logic away, the longer we remain in denial, the longer it will take for the washout point to be reached. Above all, what will be needed will be the courage of individual leaders of society to face up to the realities of life. In short: There is no such thing as a magic pudding and the global economy cannot possibly grow to the sky.
Brian Bloom
Author, Beyond Neanderthal & The Last Finesse
More from Gold-Eagle


