CoT – Gold, Silver, Commodities & T Notes


Among its 29 pages of high quality market analysis, this week’s edition reviewed the Commitments of Traders (CoT) structures of a few markets and their implications.

The above CoT graph clearly shows that gold has declined as the structure improved (red arrows). It then bottoms with the circled extremes and rises in conjunction with a degrading structure (green arrows). Gold is still on its journey toward bottoming.

Silver did much the same thing into last summer’s bottom and its convoluted CoT structure since then has gone hand in hand with its failure to get bullish with the rest of the sector early in 2014. Silver like gold, is still on its journey to whatever bottom lay ahead. Were I to affix my tin foil hat I’d say ‘sure, they’re manipulating silver’. But I’d also note there is nothing we can do about it aside from watching the signals each week, not getting hurt by it and eventually capitalizing upon it.

Courtesy of Sentimentrader.com
Commodities on average continue to look bearish by their CoT view. This could be in line with our [thoughts] that the hedge fund world (large spec’s) is in here pumping certain items beyond reason (ala uranium, copper, crude in years past).
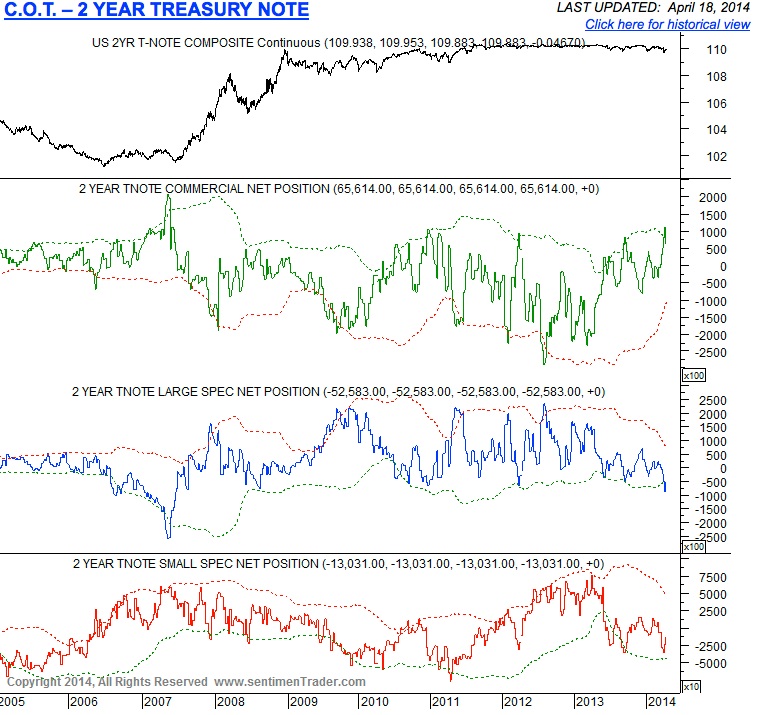
Below once again we review the CoT structure of 2-year T Notes because despite last week’s burst upward in interest rates, the commercial hedgers remain net long and the spec’s net short. They are generally at extremes.
What this tells us is that the supposed smart money expects these yields to decline again. This would likely come in tandem with a lurch toward liquidity by market players. A lurch toward liquidity would also be known as a lurch toward risk ‘OFF’. Needless to say I continue to calmly hold 1-3 year T bond fund SHY as a cash equivalent.
Courtesy of Sentimentrader.com
Interestingly, as you go up the curve you would notice that the CoT structures steadily degrade in the 5’s, 10’s on up to the 30’s. While these are not extreme or even bearish, they are not aligned to a bullish extreme like the 2-year.
The theoretical implication is that the curve will eventually start to rise again if 2’s are more bullish than for example, 10’s, because the implication is rising long-term yields in relation to short-term yields.
Could that come hand in hand with a gold bottom? Yes, but let’s patiently move forward, watch these real fundamentals and tune out the noisy stuff on the internet. A rising curve may not be as favorable for the broad markets, although it would theoretically at least, reinvigorate the banking sector’s ‘carry trade’ potential.
Courtesy of http://biiwii.com/wordpress/about-nftrh


