Could NUGT Again Rise To Over $2,000/Share?


NUGT is the symbol for DIREXION’s Daily Gold Miners Bull 3X Shares listed on the NYSE. In September 2011 NUGT was over $2,000/share. Since that time NUGT’s share price has relentlessly fallen as a consequence to the recent bear market in gold and corresponding precious metal equities:
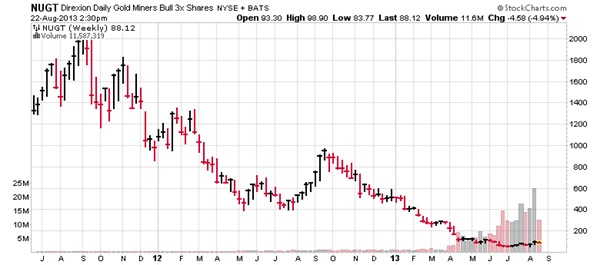
Indeed NUGT’s value has dropped substantially more than gold and gold stocks due to its 3X leverage to GDX. HOWEVER, times change…and all old bears eventually go belly-up and die. To be sure recent market action strongly suggests a new bull market in precious metals has been born. Testament to this bull statement are the following charts.
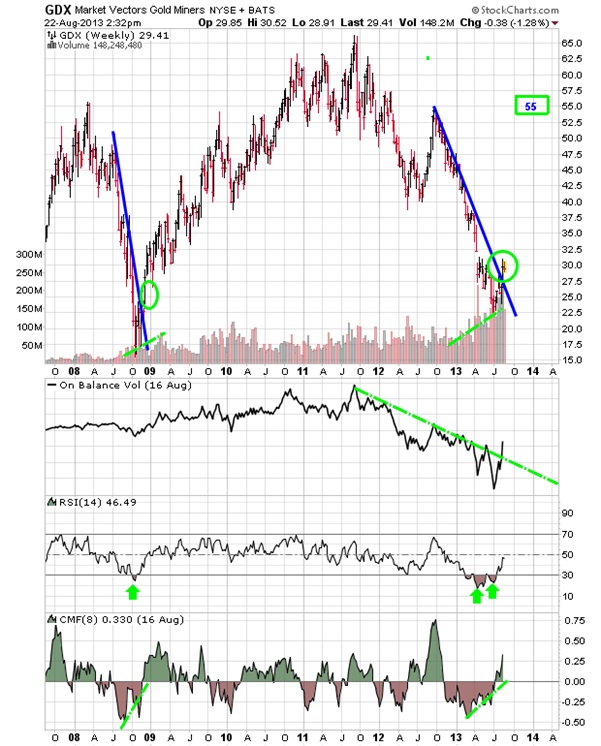
GDX (2008-2013) recently effected an 10-month upside breakout (as it did in previously in 2008). Notice all Technical Indicators (RSI, On-Balance Volume & CMF) have bottomed and have given BUY SIGNALS.
EVEN MORE SPECTACULAR is that the GDX/Gold ratio is about to effect an astounding 34-month upside breakout – thus heralding a new bull market in gold and silver mining stocks. See the wildly bullish Technical Indicators (RSI & CMF):
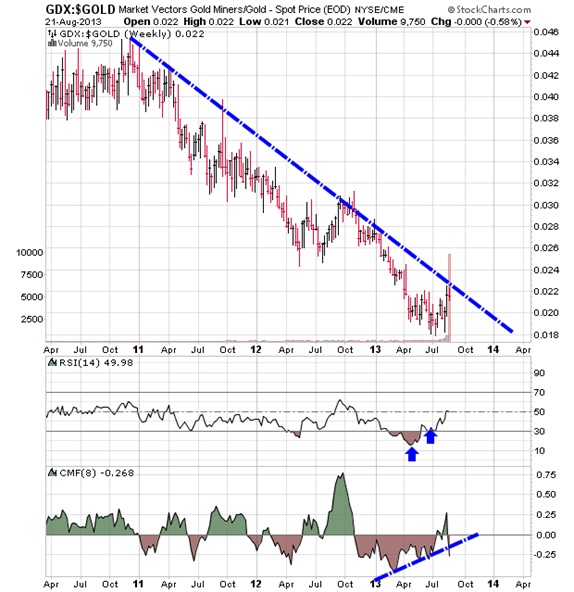
The 34-month breakout is imminent!
Short-Term GDX Forecast
The GDX is looking to replicate the 2009 breakout. Moreover, all the Technical Indicators support that forecast. On-Balance Volume, RSI and CMF. Further, it appears GDX might soar over 70% to $55 from today's price of $30 -- per W. D. Gann's Theory of Symmetry GDX might top $55 within the 5-6 months.
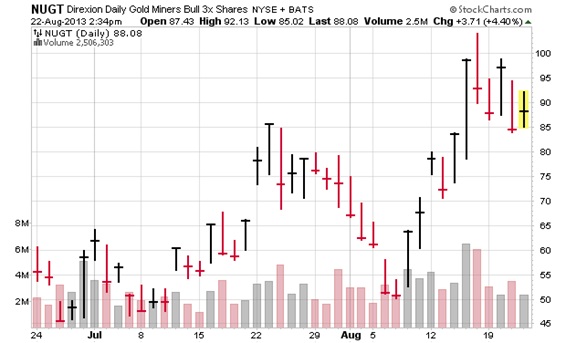
But the big beneficiary would be NUGT, which is the 3X Long ETF for GDX. Consequently if GDX rises 70%, theoretically NUGT should go ballistic up +210% -- already NUGT has soared 80% during the past couple of weeks from $50 to $90:
It is noteworthy to take another look at NUGT’s chart showing is $2,000/share price in late 2011:
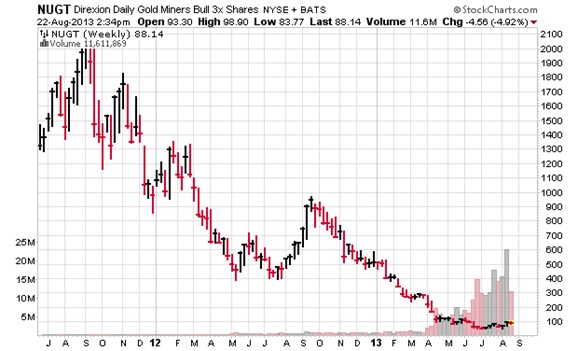
Volume Gives Birth to Price
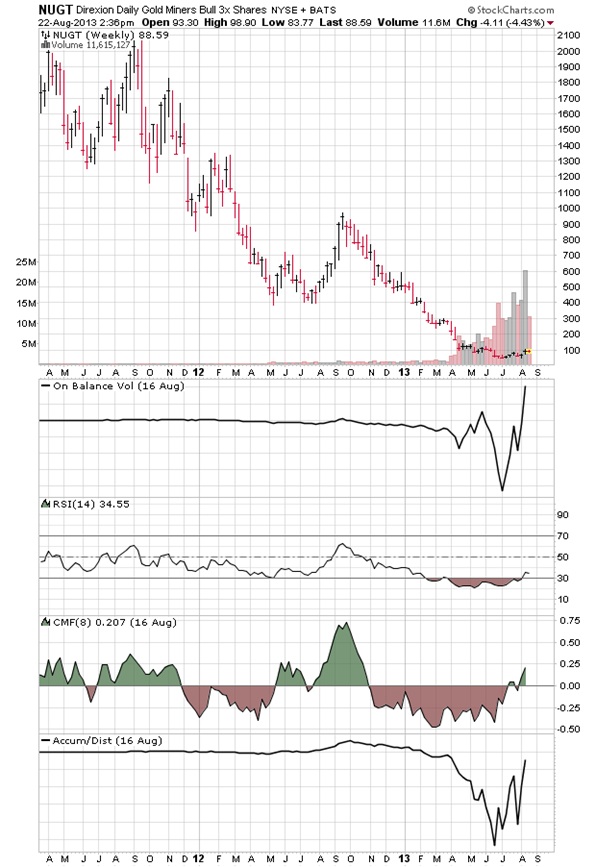
An old Wall Street adage says that “Price increase follows volume increase.” Specifically, the most spectacular aspect of NUGT is the vastly increased trading volume during the past 4 months. Indeed and in fact recent trading volume is SEVERAL TIMES GREATER than in 2011 and 2012. This obviously is indicative of mammoth Accumulation by Institutional Investors. Among the many reasons by Institutional Investors are piling into NUGT is that all the TA indicators have already bottomed. Take a peek:
MORE UNDENIABLE PROOF IF INSTITUIONAL INVESTOR BUYING OF NUGT
Each quarter all Institutional Investors must file Form 13F with the SEC, which shows their positions in any company. As of one month ago only 4% of NUGT’s outstanding shares were owned by Institutional Investors. Since then Institutional Investors ownership has TRIPLED to 12%. Needless to say this is a mammoth increase. Below are the Form 13-F Institutional Investors ownership Summary.
Company Details
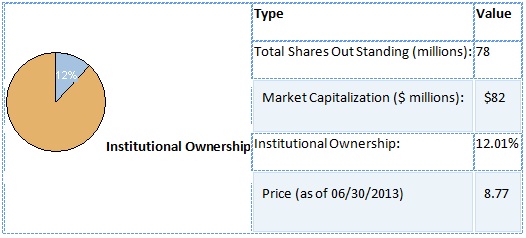
Ownership Summary
Ownership Summary
Institutional Holdings information for NUGT is filed by major institutions on form 13-F with the Securities and Exchange Commission.
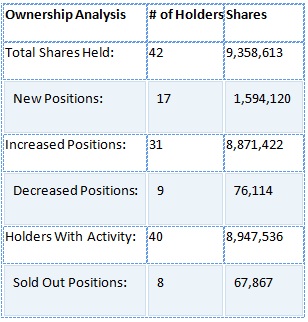
There are two remarkable aspects of the vastly increased Institutional Holdings of NUGT:
- Percent Increases and Who are the Institutional Investors.
- Percent increase in NUGT Holdings was from +199% (Bank of America Corp) to +23,548% (SUSUEHANNA INTERNATIONAL GROUP) from the previous quarter.
The list of Institutional Investors is a star-studded line-up of the world’s elite financial institutions, including Credit Suisse, BNP Paribas, CitiGroup, UBS, Bank of America, Commerzbank, Nomura Holdings, and Barclays PLC to name a few. Here are the details of NUGT Institutional Investor holdings.
42 Institutional Holders
9,358,613 Total Shares Held
Click on the column header links to resort ascending (^) or descending (v).
|
Owner Name |
Date |
Shared Held |
Change (Shares) |
Change(%) |
Value(in 1,000s) |
|---|---|---|---|---|---|
|
VIRTU FINANCIAL LLC |
06/30/2013 |
2,381,748 |
2,244,452 |
1,634.75 |
20,888 |
|
CREDIT SUISSE AG/ |
06/30/2013 |
1,930,000 |
1,800,000 |
1,384.62 |
16,926 |
|
TOWER RESEARCH CAPITAL LLC |
06/30/2013 |
1,569,168 |
1,551,760 |
8,914.06 |
13,762 |
|
HELLMAN JORDAN MANAGEMENT CO INC /MA/ |
06/30/2013 |
1,000,000 |
1,000,000 |
New |
8,770 |
|
JANE STREET HOLDING, LLC |
06/30/2013 |
544,866 |
542,359 |
21,633.79 |
4,778 |
|
SUSQUEHANNA INTERNATIONAL GROUP, LLP |
06/30/2013 |
544,380 |
542,078 |
23,548.13 |
4,774 |
|
RAFFLES ASSOCIATES LP |
06/30/2013 |
200,000 |
200,000 |
New |
1,754 |
|
BNP PARIBAS ARBITRAGE, SA |
06/30/2013 |
187,670 |
187,670 |
New |
1,646 |
|
CITIGROUP INC |
06/30/2013 |
172,840 |
154,744 |
855.13 |
1,516 |
|
BARCLAYS PLC |
06/30/2013 |
168,832 |
136,989 |
430.20 |
1,481 |
|
NOMURA HOLDINGS INC |
06/30/2013 |
144,568 |
122,137 |
544.50 |
1,268 |
|
UBS AG |
06/30/2013 |
109,390 |
81,429 |
291.22 |
959 |
|
COMMERZBANK AKTIENGESELLSCHAFT /FI |
06/30/2013 |
71,628 |
34,560 |
93.23 |
628 |
|
BANK OF AMERICA CORP /DE/ |
06/30/2013 |
60,493 |
40,284 |
199.34 |
531 |
|
WOLVERINE ASSET MANAGEMENT LLC |
06/30/2013 |
40,500 |
40,500 |
New |
355 |
( Source: http://www.nasdaq.com/symbol/nugt/institutional-holdings )
Medium-Term NUGT Forecast
My forecast is predicated on the following NUGT chart ratios, which show imminent breakouts looming:
NUGT/GDX Chart
http://stockcharts.com/h-sc/ui?s=NUGT:GDX&p=W&yr=2&mn=2&dy=0&id=p27431047803
NUGT/Gold Chart
http://stockcharts.com/h-sc/ui?s=NUGT:$GOLD&p=W&yr=2&mn=2&dy=0&id=p63533872030
NUGT/DOW Chart
http://stockcharts.com/h-sc/ui?s=NUGT:$INDU&p=W&yr=2&mn=2&dy=0&id=p36302987568
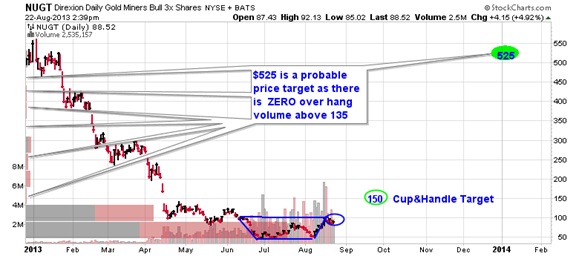
However, the most convincing chart shows NUGT with a Cup & Handle pattern with an imminent breakout that should fuel the price to $150. But also notice there is practically ZERO over-head volume above 135, which would hamper upward price movement. Therefore, a price rise from 135 to 525 resistance might be achieved with surprising ease and short timeframe.
********
The above is my personal opinion based upon traditional interpretation of Technical Analysis Methods. Consequently, it should NOT be construed as advice to buy or sell anything. Everyone should do their own Due Diligence and consult a Registered Representative.
DISCLOSURE: I BOUGHT NUGT THIS WEEK…AND WILL BUY MORE AS THE PRICE RISES.
August 22, 2013


