The Gold-Silver Ratio Explained: How To Use The 80/60 Rule
Understanding one of precious metals investing's most reliable indicators


The gold-silver ratio exceeded 80:1 in late 2023—a level that historically signals silver is undervalued relative to gold. Investors who recognized this signal and positioned accordingly captured exceptional returns as silver surged approximately 148% through the end of 2025 — then continued higher into January 2026, ultimately reaching an all-time high of $121.62 — while the ratio compressed dramatically. As I write this, gold is trading near $5,100 per ounce and silver around $84.59, pushing the ratio down to approximately 60:1—right at the lower boundary of the neutral zone in the very framework this article describes.
This wasn't luck or market timing wizardry. It was the application of a strategy that's worked repeatedly throughout history, based on a simple principle: extreme valuations between gold and silver tend to revert to their long-term averages.
For precious metals investors, understanding how to read and use the gold-silver ratio can significantly improve portfolio returns. Here's everything you need to know about this powerful—yet often misunderstood—investment tool.
What Is the Gold-Silver Ratio?
 The gold-silver ratio (GSR) measures how many ounces of silver are needed to purchase one ounce of gold. The calculation is straightforward:
Gold Price ÷ Silver Price = Gold-Silver Ratio
For example, as of February 21, 2026, with gold at $5,106.38 per ounce and silver at $84.59, the ratio is approximately 60.35:1. This means you would need roughly 60 ounces of silver to buy one ounce of gold—a dramatically different picture than when this ratio sat above 80:1 just two years ago.
While the calculation is simple, the implications are profound. The ratio provides a relative valuation between the two metals, helping investors identify when one is historically cheap or expensive compared to the other.
Historical Context: What's "Normal"?
To understand whether the current ratio signals opportunity, we need historical context.
Ancient to Early Modern History
The relationship between gold and silver has been recognized for millennia. The Roman Empire fixed the official exchange rate at approximately 12:1. The U.S. Coinage Act of 1792 set the ratio at 15:1 by law. Before the 20th century, the ratio generally ranged between 10:1 and 20:1 when both metals served as monetary standards.
Modern Era (20th–21st Century)
Once silver was largely demonetized and both metals began trading freely, the ratio became more volatile. The historical average from 1900 to 2000 was approximately 50:1 to 60:1, with a common trading range of 40:1 to 80:1 and extreme readings ranging from 15:1 to 125:1.
Recent Extremes Tell the Story
Looking at recent decades, we can see how extreme ratio readings have preceded significant moves in silver.
January 1980 — 16:1. During silver's parabolic rise to nearly $50 per ounce (the Hunt Brothers era), the ratio compressed to historically tight levels. Silver had dramatically outperformed gold, bringing the two metals' values closer together than at almost any other time in modern history.
April 2011 — 31:1. As silver spiked to $48.70 per ounce following the 2008 financial crisis, the ratio compressed again. Silver had surged from roughly $10 in 2008 to nearly $50 in 2011, vastly outpacing gold's gains.
March 2020 — 125:1. During the COVID-19 panic, the ratio exploded to an all-time high as investors rushed into gold while silver—more dependent on industrial demand—sold off sharply. This extreme proved temporary, as silver subsequently rallied 47.9% while gold gained 25.1% over the following months.
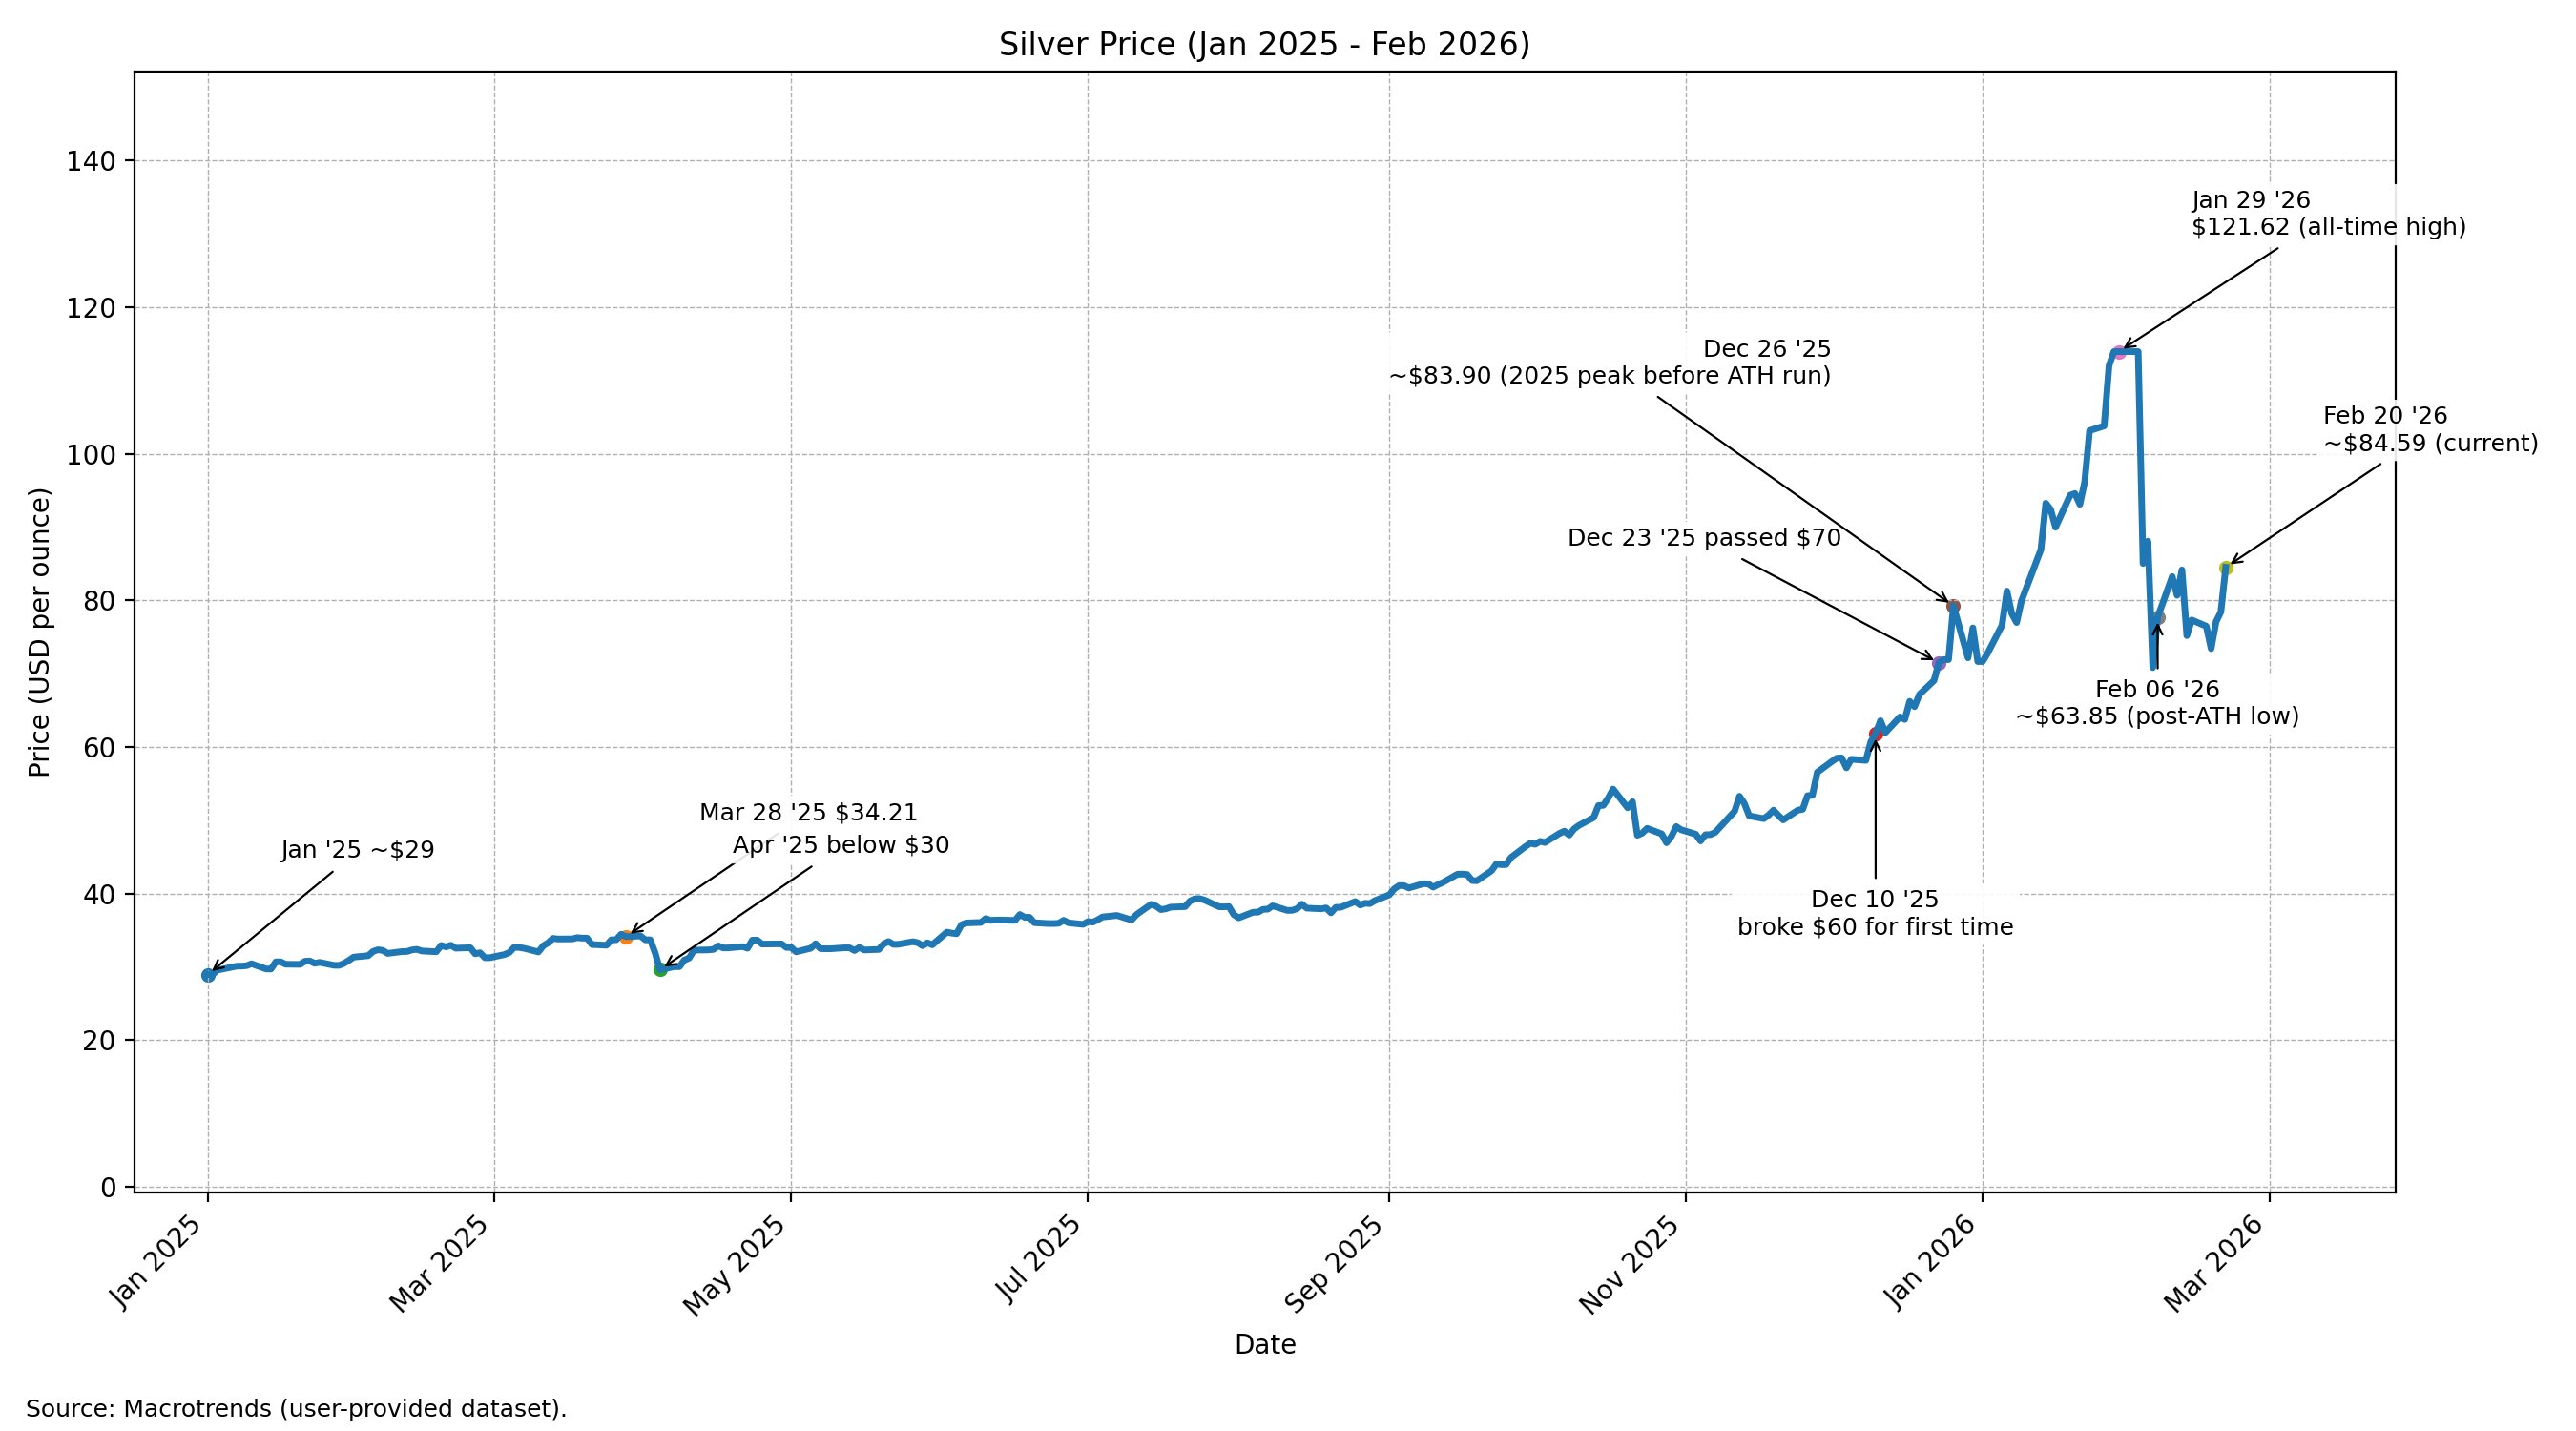
Late 2023–Early 2024 — 80–85:1. The ratio hovered in the low-to-mid 80s, a level that has historically preceded silver outperformance. What followed was a textbook example of mean reversion: silver surged approximately 148% through the end of 2025, then continued climbing into January 2026, breaking through both the 1980 and 2011 price peaks before setting a new all-time high of $121.62 on January 29, 2026.
February 2026 — ~60:1. As of today, the ratio has compressed to approximately 60:1, reflecting silver's extraordinary outperformance. This is no longer an extreme buy signal for silver—it's right at the neutral zone boundary, which itself is a significant development for investors who have been following this framework.
If you want to dive deeper into the full historical data behind these ratio cycles, I cover it extensively in The Silver Investing Guide.
The 80/60 Rule: A Framework for Action
Experienced precious metals investors use the gold-silver ratio to time tactical allocations between gold and silver. The most widely followed framework is what's known as the "80/60 rule":
When the Ratio Rises Above 80:1 → Silver May Be Undervalued
Historically, when the ratio exceeds 80:1, it signals that silver is cheap relative to gold. At these levels, investors might consider adding to silver positions, rebalancing portfolios to increase silver allocation, or in some cases, trading gold for silver to capitalize on eventual mean reversion.
When the Ratio Falls Below 60:1 → Gold May Be Undervalued
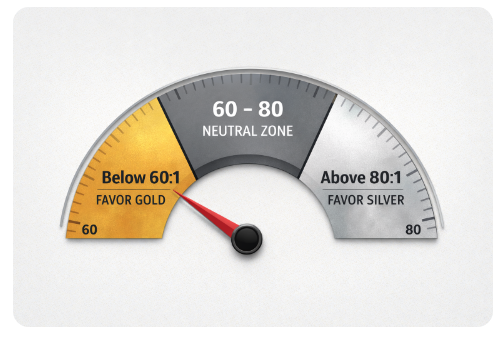 Conversely, when the ratio compresses below 60:1, it suggests silver has outperformed to a degree where gold may offer better relative value. Investors might reduce silver positions, increase gold allocation, or trade silver profits back into gold.
The 60–80 Range → Neutral Zone
When the ratio sits between 60:1 and 80:1, neither metal appears significantly mispriced relative to the other. Investors typically maintain their existing allocations or follow dollar-cost averaging strategies without tactical adjustments.
Where are we today?
With the ratio at approximately 60:1, we are sitting precisely at the lower boundary of the neutral zone. The dramatic opportunity to overweight silver has largely played out. This doesn't mean silver can't continue rising—gold is near $5,100 and silver near $85, and both markets remain dynamic. But from a ratio perspective, the framework is now pointing toward maintaining balanced allocations, or for investors who added heavily to silver at 80+, beginning to think about gradual rebalancing back toward gold.
Why This Strategy Works: Mean Reversion
The 80/60 rule capitalizes on a fundamental market principle: mean reversion. Extreme valuations in any market tend to correct over time as conditions normalize.
Several factors drive the gold-silver ratio back toward its historical average. When the ratio reaches extremes, it attracts attention from investors who recognize the historical pattern, creating buying pressure on the undervalued metal. Extreme ratios often reflect temporary market dislocations rather than permanent shifts in the metals' relative value. And professional traders and institutions actively monitor the ratio for arbitrage opportunities, helping to prevent sustained extreme valuations.
Silver's dual role as both a precious metal and an industrial commodity also drives ratio movements. Its supply-demand dynamics can shift more dramatically than gold's, creating the conditions for both extreme readings and sharp reversions.
Historical Proof: The Strategy in Action
The 2018–2020 Cycle
The ratio climbed above 85:1 as gold strengthened while silver languished. During the pandemic, the ratio briefly spiked to an unprecedented 125:1—an even more extreme buy signal. As markets normalized, the ratio rapidly compressed back toward 70:1. Silver surged 47.9% while gold gained 25.1%. Those who bought silver when the ratio exceeded 85:1 captured exceptional returns plus additional gains from ratio compression.
The 2024–2026 Validation
This is now one of the most thoroughly validated examples of the gold-silver ratio strategy in market history.
The Setup (Late 2023–Early 2024): The ratio hovered consistently in the low-to-mid 80s. This triggered the classic "buy silver" signal. At the time, silver was trading below $30 per ounce.
The Payoff (2025–2026): Silver's subsequent move was historic by any measure. The metal surged approximately 148% through the end of 2025 — its strongest annual performance since 1979 — then continued climbing into January 2026, ultimately peaking at a new all-time high of $121.62. It broke through both the 1980 peak ($49.45) and the 2011 peak ($48.70) on its way to a new all-time high of $121.62 on January 29, 2026. After a sharp correction, silver has recovered to approximately $84.59 as of this writing—still representing an extraordinary gain from sub-$30 levels two years prior.
As silver outperformed, the ratio compressed from 80+ down to approximately 60:1—precisely the neutral zone boundary identified by the framework.
Investors who followed the 80/60 rule and purchased silver when the ratio exceeded 80:1 captured extraordinary gains from silver's price appreciation, additional returns from ratio compression itself, and a real-world validation of the mean reversion principle that has worked for decades.

The Math Behind Ratio Compression
Understanding the mechanics of ratio compression helps illustrate why the strategy is so powerful.
Scenario 1: Both Metals Rise Equally (No Ratio Change)
Assume you own 1 ounce of gold worth $2,800 when the ratio is 87.5:1 (silver at $32). If both metals rise 25%, gold moves from $2,800 to $3,500 and silver from $32 to $40. The ratio remains 87.5:1 and your 1 oz of gold is worth $3,500.
Scenario 2: Same Price Rise, But Ratio Compresses to 60:1
Now assume gold still rises 25% to $3,500, but the ratio compresses to 60:1. Silver must rise to $58.33 ($3,500 ÷ 60)—an 82% gain versus gold's 25%. If you had traded your 1 oz of gold for 87.5 oz of silver when the ratio was 87.5:1, your 87.5 oz of silver at $58.33 each equals $5,103.88, compared to holding gold worth $3,500. You gained an additional 46% through ratio compression alone.
The 2025 cycle demonstrated this effect in real, dramatic terms—not just in theory.
Practical Application: How to Use the Ratio Today
Step 1: Monitor the Ratio Regularly
You can calculate the current ratio yourself using any financial website. Look up the current gold price, look up the current silver price, divide gold by silver, and compare to historical ranges. Many precious metals websites also publish the current ratio directly.
Step 2: Identify Your Strategy
For dollar-cost averaging, use the ratio to determine your allocation. Ratio above 80: allocate 60–70% of new purchases to silver. Ratio 60–80: maintain a balanced approach. Ratio below 60: allocate 60–70% of new purchases to gold.
For portfolio rebalancing, review your allocation whenever the ratio moves more than 10 points. Consider rebalancing when the ratio reaches the 80+ or sub-60 thresholds.
For tactical trading, more active traders might trade between gold and silver directly—trading gold for silver when the ratio exceeds 90:1, and trading silver for gold when the ratio falls below 50:1. This requires careful execution and understanding of transaction costs.
Step 3: Consider the Broader Context
The ratio works best when combined with fundamental analysis. Before making allocation decisions, also evaluate supply and demand fundamentals, market conditions, and your personal situation including investment timeline and risk tolerance.
What Makes the Current Environment Different
While the gold-silver ratio has provided reliable signals for decades, today's silver market has characteristics that didn't exist in previous cycles.
 The Industrial Transformation
Silver's demand composition has fundamentally shifted. Industrial applications now account for the majority of silver demand, with solar panels, electric vehicles, AI data centers, and semiconductor manufacturing creating non-discretionary buying pressure. Companies building these technologies must buy silver regardless of price—a demand floor that simply didn't exist when silver was primarily a monetary metal.
The Silver Institute projects 2026 will mark the sixth consecutive year of silver market deficits, with a shortfall of approximately 67 million ounces expected. The cumulative deficit from 2021 through 2025 reached nearly 820 million ounces—a sustained structural imbalance with no easy near-term resolution.
Supply Constraints
Unlike previous cycles where high silver prices could relatively quickly bring on new supply, today's market faces structural constraints. The majority of silver is a byproduct of mining other metals, primarily copper, lead, and zinc, which means silver production doesn't respond quickly to silver-specific price signals. New mine development takes 5–8 years from discovery to production.
Critical Mineral Designation
The U.S. government has officially designated silver as a critical mineral, placing it in the same strategic category as rare earth elements. This recognition of silver's essential role in renewable energy infrastructure, electric vehicle production, advanced electronics, and national defense adds a layer of strategic importance that goes beyond traditional precious metals investing.
New Drivers in This Cycle
The 2025–2026 rally also featured drivers that weren't present in previous cycles. China's tighter controls on silver exports constrained global supply. Geopolitical tensions elevated safe-haven demand. AI-related data center construction emerged as a meaningful new source of industrial silver demand. And ETF inflows dominated price action for both gold and silver from October 2025 onward, with price sensitivity to ETF flows explaining roughly 65% of silver's price increase during that period.
Common Misconceptions About the Ratio
"The Ratio Tells You Which Metal Will Rise"
The ratio indicates relative valuation, not absolute direction. Both metals could rise—the ratio just suggests which might rise more. Conversely, both could fall, with one falling less than the other.
"Extreme Ratios Always Reverse Immediately"
Markets can remain irrational longer than you expect. The ratio hit 100:1 in 2020 before spiking to 125:1. Timing matters, and extreme readings can persist during periods of stress.
"The 80/60 Rule Is Absolute"
These are guidelines, not laws. Some investors use 90/50, others 85/55. The key is recognizing when valuations are historically extreme, not following exact numbers rigidly.
"The Ratio Works in All Timeframes"
The ratio is best used for tactical adjustments over months or years, not for day trading. Short-term ratio movements are often noise rather than signal.
The Limitations and Risks
No investment strategy works 100% of the time, and the gold-silver ratio is no exception.
While extreme ratios tend to revert to the mean, the timing can vary significantly. An investor who bought silver at an 85:1 ratio might have to wait months or even years for meaningful compression. Each trade also involves costs—dealer spreads for physical metal, commissions for ETFs, or bid-ask spreads for futures—which can erode returns through frequent trading.
Silver is roughly 2–3 times more volatile than gold, as the January 2026 experience demonstrated vividly: silver surged to $121.62 on January 29, then crashed nearly 47% to roughly $64 by February 6, before recovering back to the $84 range. A strategy that increases silver allocation during high ratio periods also increases portfolio volatility, and this may not be appropriate for all investors.
It's also conceivable that structural changes could alter the "normal" ratio range permanently. The massive increase in silver's industrial demand could theoretically support a lower long-term average ratio than the historical 50–60:1 range—meaning what we once called a "buy signal" at 60:1 might in the future represent fair value or even slight overvaluation for silver.
How the 2025 Rally Validated the Framework
The 2024–2026 period provided perhaps the clearest real-world validation of the gold-silver ratio strategy in recent memory.
When the ratio exceeded 80:1 in late 2023, it generated a high-confidence signal—not just because the ratio was elevated, but because the reading persisted for months, fundamental factors supported compression (supply deficits, growing industrial demand), and historical precedent was clear.
What followed wasn't just silver appreciation—it was one of the most dramatic precious metals moves in decades. Silver opened 2025 at approximately $30 per ounce and surged to a new all-time high of $121.62 on January 29, 2026, gaining more than 279% from its 2025 opening price at its peak. The ratio compressed from 80+ all the way down to approximately 60—precisely as the framework predicted.
This demonstrates a crucial point: the ratio strategy works best when the signal aligns with fundamental factors. The ratio alone might suggest relative value, but when combined with supply deficits, surging industrial demand, and positive technical factors, the opportunity becomes more compelling.
Looking Forward: Where Does the Ratio Go From Here?
As of February 2026, the ratio sits at approximately 60:1—right at the lower boundary of the neutral zone. This is a genuinely pivotal moment for the framework.
Silver has experienced one of the most dramatic rallies in its history. After peaking at $121.62 in late January, it experienced a sharp 47% correction before recovering to the current $84 range. Gold, meanwhile, has continued its own powerful bull market to above $5,100. The ratio now sits where neither metal looks dramatically mispriced relative to the other by historical standards.
 Several scenarios are possible from here. If silver resumes its rally and the ratio breaks below 60:1, the framework would begin pointing toward reducing silver exposure and gradually increasing gold allocation—exactly the opposite signal from late 2023. If the ratio stabilizes in the 55–65 range, it may suggest the long-term "normal" is resetting lower due to structural industrial demand. And if silver consolidates or pulls back further while gold continues higher, the ratio could move back into the neutral zone or even approach 70+, potentially setting up the next tactical opportunity.
The fundamental case for silver remains intact. The Silver Institute projects 2026 will be the sixth consecutive year of silver market deficits, with a shortfall of approximately 67 million ounces and global ETP holdings standing at an estimated 1.31 billion ounces. Supply constraints aren't going away overnight, and industrial demand from solar, EVs, and AI infrastructure continues growing.
After a rally of approximately 148% through 2025 — and significantly more at its January 2026 peak — investors should approach the ratio with a different mindset than they did when it was 80+. The "screaming buy silver" signal has been answered. The question now is about managing what may be substantial gains, rebalancing thoughtfully, and watching for the ratio's next meaningful signal in either direction.
For a deeper look at whether silver's fundamentals still support higher prices from current levels, see my recent analysis After Surging to $121, Is Silver Still A Good Investment?
Conclusion: A Tool, Not a Crystal Ball
The gold-silver ratio has proven itself as one of precious metals investing's most reliable indicators. The 80/60 rule provides a framework for identifying relative value between gold and silver, and history demonstrates that extreme readings tend to revert to more normal levels over time.
The 2024–2026 period offered a textbook example: the ratio exceeded 80:1, silver was systematically accumulated by those following the framework, and a rally of approximately 148% through 2025 ensued — extending even further into January 2026's all-time high of $121.62 — as the ratio compressed all the way from 80+ to approximately 60:1. Silver set a new all-time high of $121.62 along the way. This wasn't luck—it was pattern recognition based on decades of historical precedent.
Today, with the ratio at the neutral zone boundary, the framework tells us something equally important: the extreme opportunity has largely played out. That's not a bearish call on silver—it's the strategy working exactly as designed.
The ratio is a tool for tactical allocation, not a guarantee of future performance. It works best when combined with fundamental analysis of supply and demand, applied patiently over appropriate time horizons, and used to guide allocation rather than dictate all-or-nothing positions.
Whether the ratio compresses further below 60 (a potential signal to begin favoring gold), stabilizes at a new lower normal, or eventually expands back toward 80 (setting up the next silver opportunity) depends on numerous factors. But by monitoring it regularly and understanding its implications, investors position themselves to recognize opportunities when relative valuations reach meaningful extremes—and to recognize when those extremes have been resolved.
Taking Your Silver Analysis Further
Understanding the gold-silver ratio is an important component of precious metals investing, but it's just one piece of a more comprehensive picture.
The ratio helps identify relative value between gold and silver, but to make fully informed investment decisions, you also need to understand:
- Silver's supply crisis: Why six consecutive years of deficits matter and why production can't quickly respond even at higher prices
- Industrial demand dynamics: How solar, EVs, and AI infrastructure create non-discretionary buying pressure
- Investment vehicle selection: The pros and cons of physical bullion, ETFs, mining stocks, and IRAs
- Portfolio management frameworks: Specific allocation strategies based on risk tolerance and investment goals
- What comes after a major rally: How to evaluate silver after its historic 2025-2026 surge and whether the fundamentals still support higher prices
I recently completed a comprehensive analysis of exactly these topics: The Silver Investing Guide.
The 54-page guide covers everything from the fundamentals that drove the 2025 rally to specific investment strategies and portfolio management approaches. It includes the complete gold-silver ratio analysis with historical data, plus detailed sections on supply-demand dynamics, industrial applications, and practical investment methods.
The guide is free—I just ask for your email to deliver it:
Download The Silver Investing Guide (Free)
What you'll find inside:
- Complete analysis of the 2025-2026 rally and what drove it
- Five-year supply deficit breakdown with supporting data
- Record industrial demand analysis (680.5M oz in 2024)
- Gold/silver ratio strategy with historical examples
- Investment methods comparison (physical, ETFs, miners, IRAs)
- Portfolio allocation frameworks and rebalancing strategies
- Where industry analysts see prices heading and why
Whether you're building your first silver position or refining an existing precious metals portfolio, the guide provides the data-driven analysis to make informed decisions.
[Note: By downloading the guide, you'll also receive our popular gold and precious metals newsletter. You can unsubscribe anytime.]
Also read: After Surging to $121, Is Silver Still a Good Investment? | Why Solar Panels, EVs, and AI Are Driving Silver Demand to Record Highs


