Current Market Analysis Via Technical Analysis


SPX: Long-term trend - Bull Market
Intermediate trend – Waiting for confirmation that the ending diagonal is complete.
Analysis of the short-term trend is done on a daily basis with the help of hourly charts. It is an important adjunct to the analysis of daily and weekly charts which discusses the course of longer market trends.
MORE DECLINE AHEAD?
Market Overview
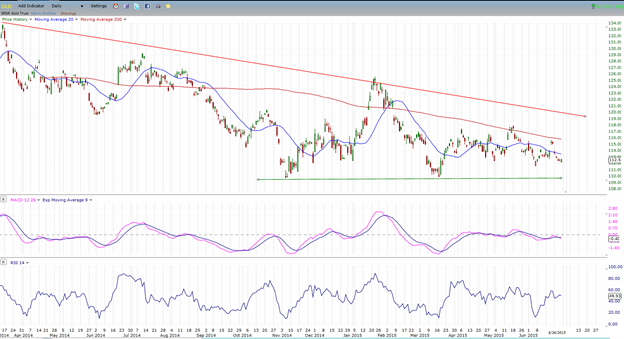
Since the October rally ended, the SPX formed what looked like an extended distribution phase in the form of a rounding top. This is even more apparent on the Dow Jones Composite index which is posted below. In early June, after dropping below its 200-DMA, it slightly breached its December low, but rallied. A second attempt was made to break through which also failed. The rallies found resistance at the MA and, last week, a third attempt at breaking the bottom trend line also failed … or did it? With Greece’s projected default at the end of the month, Monday could see this index completing its rounding top/descending triangle pattern by finally making a new low. A Monday morning opening gap to the downside would be the perfect way to end this formation.

Greece’s decision to hold a referendum on July 5 on whether or not to accept the final offer made by its creditors will most likely result in a Greek debt default next week and is expected to unsettle markets and create a negative opening on Monday morning. Should that be the case, SPX should follow suit by extending last week’s decline and perhaps seizing the opportunity to fulfill long–standing expectations that it is ready for an intermediate correction. However, as stated by Mohamed a. El-Erian: “…there are genuine questions as to whether Greece’s situation won’t have radically evolved by the time the vote is scheduled to take place, forcing a different reality.” In any case, we could be in for a few days of interesting market activity.
Indicators survey
Four weeks ago, the weekly MACD penetrated its long-term uptrend line, a move which is often soon followed by similar action in the price index. Last week, it continued its downtrend and is now very close to moving beyond its October low.
After a brief uptrend, the daily MACD has turned back down and is just about ready to go negative.
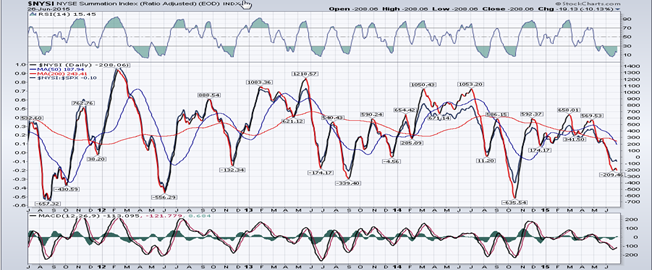
The McClellan oscillator could not stand for long to be positive and turned down again, which caused the NYSE Summation Index (courtesy of MarketCharts.com) to resume its downward course.
Over the past two weeks, the 1X P&F chart has formed a distribution pattern from which can be derived a potential count which has only partially been satisfied.
Is the bottoming 7-year cycle finally closing its grip on the market by applying pressure which is increasing gradually every week? This is what is reflected by the 3X P&F chart.
Chart Analysis
The Daily SPX (chart courtesy of QCharts.com, including others below) is slowly exiting the top half of its intermediate channel (blue lines) and beginning to trade more and more in the lower half. Granted, it’s been a slow process but it appears inexorable. Last week it tested the 2135 high, but turned down five points short. This could be the first sign that it has finally made an intermediate top which will not be challenged for some time. Now that it has made a lower high, all it needs to do is to close below 2072, which would be a lower low, and voila, we are technically in a short-term downtrend for the first time since early February (which was short-lived), and the second time since October.
Note how the short trend lines which are parallel to the main trend line from the October low tend to form small price channels which are eventually penetrated to the downside. We are now in the third one since the middle of March and, on Friday, prices rallied after nearly touching the bottom line. If the current pattern follows the preceding ones, it should break through the bottom channel line. Things often happen in threes in the market, e.g. corrective waves, triple tops and bottoms, etc…, after which a significant change of behavior occurs. As discussed earlier, this could happen again this time -- perhaps with a forceful decline which would also continue below the 144-MA which has contained all short-term lows since October.
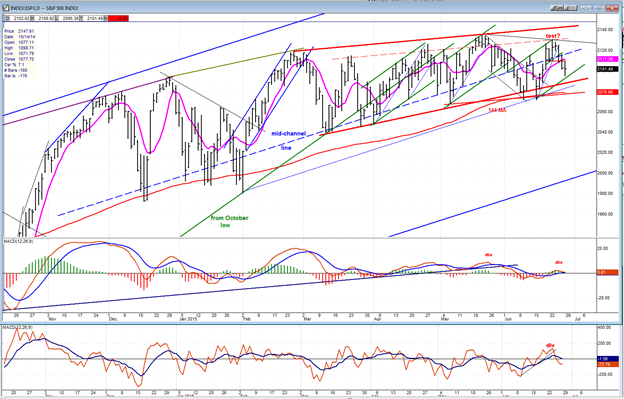
The indicators tend to agree that more weakness is in store. Both oscillators have already turned down, and price has closed for two consecutive days below its short-term MA.
The hourly chart clearly shows the green channel in which prices are currently traveling. Within it, we had a black channel which contained prices until it was broken, after which the index started a decline which almost reached the bottom of the green channel, followed by a bounce into the close. We must take into consideration that there was a lot of uncertainty going into the weekend, with a last-ditch effort underway, and a meeting scheduled for Saturday in order to arrive at an agreement with Greece. The situation changed dramatically after the close when a referendum was scheduled. If there is no change by Monday morning, the chart pattern could be altered significantly.
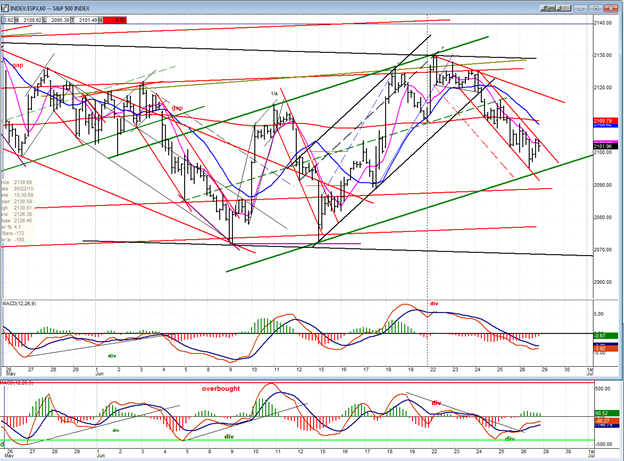
“The hourly indicators have turned down but, because they did not show divergence at the rally top, another leg up could develop as soon as they have stabilized.” Friday’s close is marked with a vertical dotted line.
You can see what happened the next day but, with the new high, negative divergence did appear, which allowed a top to form soon afterward. Currently, the oscillators are mixed with the price still declining and the A/D staging a rally but still negative. This fits with Friday’s uncertainty mentioned above.
XBD – IWM – QQQ
If you recall, last week I said that our three market leaders were making patterns that could start looking interesting in a couple of weeks. If things evolve as expected on Monday, we won’t have to wait that long. I had also mentioned that QQQ was the weakest of the three and appeared to be making a congestion top which was still lacking in the other two. IWM and XBD both made marginal new highs last week. QQQ proved that it was the weakest by refusing to do so -- by four cents! My analysis is based on the pattern formed by the MACD of each index which shows negative divergence, with QQQ’s clearly the most pronounced.

UUP (dollar ETF)
The dollar looks ready to extend its uptrend. After an initial move out of its consolidation pattern and a retest of the low, it has held above the 200-DMA and is now attempting a second break-out.

GLD (Gold trust)
Will the Greek situation affect gold? And what if the dollar moves up at the same time; will that also have an effect on gold? We’ll just have to see how that plays out next week, but a noted cycle analyst believes that major cycles will continue to suppress gold until the middle of July.
USO (US Oil Fund)
There has been little movement in USO for several weeks. The next trend is expected to be down, but we will have to wait for confirmation that it has started.

Summary
News which has dramatically altered the Greek situation and is expected to have an immediate impact on the worlds’ markets came out after the close on Friday. If nothing has changed by Monday morning, a sharply lower opening is expected. If so, this could be the beginning of the intermediate correction which has long been expected.
********
FREE TRIAL SUBSCRIPTON
Market Turning Points is an uncommonly dependable, reasonably priced service providing intra-day market updates, a daily Market Summary, and detailed weekend reports. It is ideally suited to traders, but it can also be valuable to investors since highly accurate longer-term price projections are provided using Point & Figure analysis and Fibonacci projections. Best-time reversal estimates are obtained from cycle analysis.
For a FREE 4-week trial, send an email to: [email protected]
For further subscription options, payment plans, weekly newsletters, and for general information, I encourage you to visit my website at www.marketurningpoints.com . By clicking on "Free Newsletter" you can get a preview of the latest newsletter which is normally posted on Sunday afternoon (unless it happens to be a 3-day weekend in which case it could be posted on Monday).
The above comments and those made in the daily updates and the Market Summary about the financial markets are based purely on what I consider to be sound technical analysis principles. They represent my own opinion and are not meant to be construed as trading or investment advice, but are offered as an analytical point of view which might be of interest to those who follow stock market cycles and technical analysis.

When Andre Gratian was a stock broker years ago, a friend introduced him to technical analysis of the market. Consequently, it is not an exaggeration to say that Andre fell in love with this approach! Ever since then, it has become an increasingly important part of his professional life. Gratian has studied the works of Wyckoff, Edwards & Magee, Edward J. Dewey (cycles) and many others. However, one of my most profitable undertaking has probably been to study Point & Figure charting, which he finds invaluable in analyzing stocks and indices. If he were restricted to one methodology, this is the one that he would choose. This well-rounded background has given him what he feels to be a special insight into the stock market, facilitating the recognition of meaningful patterns and the ‘turning points’ in all trends, whether they be short or long term. Andre feels very comfortable discussing the stock market and passing on meaningful information to others. His subscribers include individuals and money managers throughout the world. Moreover, his Newsletters are currently published on several financial sites, here and abroad.
More from Gold-Eagle


