Current Position Of The Market


Current Position of the Market
SPX Long-term trend: Uptrend continues.
SPX Intermediate-trend: The correction from 2400 on 3/08 continues, possibly as the top of the B-wave.
Analysis of the short-term trend is done on a daily-basis with the help of hourly charts. It is an important adjunct to the analysis of daily and weekly charts which discuss longer market trends.
B-wave Still Favored
Market Overview
SPX is poised to reach the high of the B-wave, perhaps by making it to the 2410 alternate projection which was suggested many moons ago when we discussed the point & figure objective for the uptrend which started at 1810. The most recent re-accumulation pattern is giving confirming counts which appear to be valid. However, like all technical analysis methodologies, determining P&F targets is not an exact science and 2410 does not have hit exactly!
The rally which occurred on Friday was probably caused by expectations that the preferred candidate will win in Sunday’s French election. A similar market reaction was seen after the elimination phase, two weeks ago, when results were announced. Both can be viewed as the necessary catalysts to accommodate the desired structure. However, If the current rally is sustained much beyond 1410, we will have to revise our assumption that this is a wave B.
Cycles making their lows directly ahead have shaped the view that we are due for a significant pull-back in the near future, and the first of the two which are anticipated over the short-term will be overdue after next week. Also, with Friday’s rally, some negative divergence has appeared in the daily momentum oscillator. This is the final warning that a top is not too far away.
Analysis: (These Charts and subsequent ones courtesy of QCharts.com)
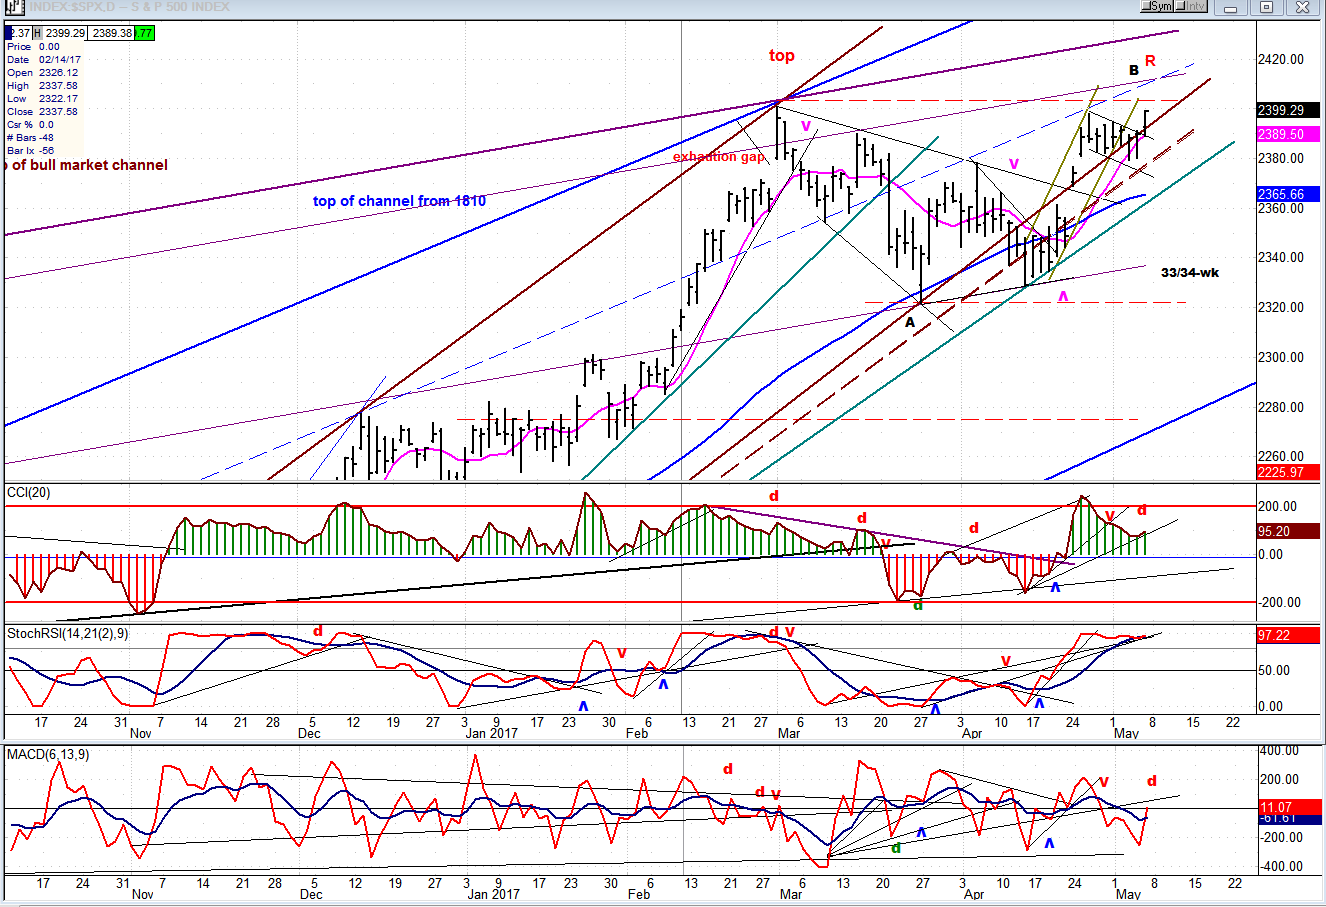
Daily Chart
There are two ways to determine the channel from 2084: either with a parallel (dashed line) to the brown line connecting the two tops, or with a solid trend line connecting the 2084 low with the lowest retracement point after the first top. In either case, the channel line was breached by a narrow margin, with the break holding above the former low, suggesting that we were not quite ready to start a decline, and that another up-wave could develop.
A final wave did develop which was contained within a steep narrow channel, with price moving out of it at the end of last week and starting what is probably the fifth small wave from 2329. Most of the move has already taken place, and it is likely that it will come to an end on Monday or Tuesday, probably near the intersection of the two lines just below the red R(esistance). The A wave completed at 2323, and the current move should finish the B wave, after which we should start a declne which could measure as much as one hundred points. A .382 retracement from the assumed top of 2410 would bring us back down to about 2288 which is in the vicinity of the bottom line of the channel from 2084 and on top of a congestion level which would provide good support.
We normally have to wait for daily indicators to show divergence before a rally is complete and a decline begins. This is what happened at the first top of 2400. Until Friday, we did not have negative divergence showing in the top indicator. It had become overbought and was correcting, but it was not until Friday that it turned up again and created the divergence. A reversal below the last small wave 4 low would break both channel lines and confirm that wave C is starting.
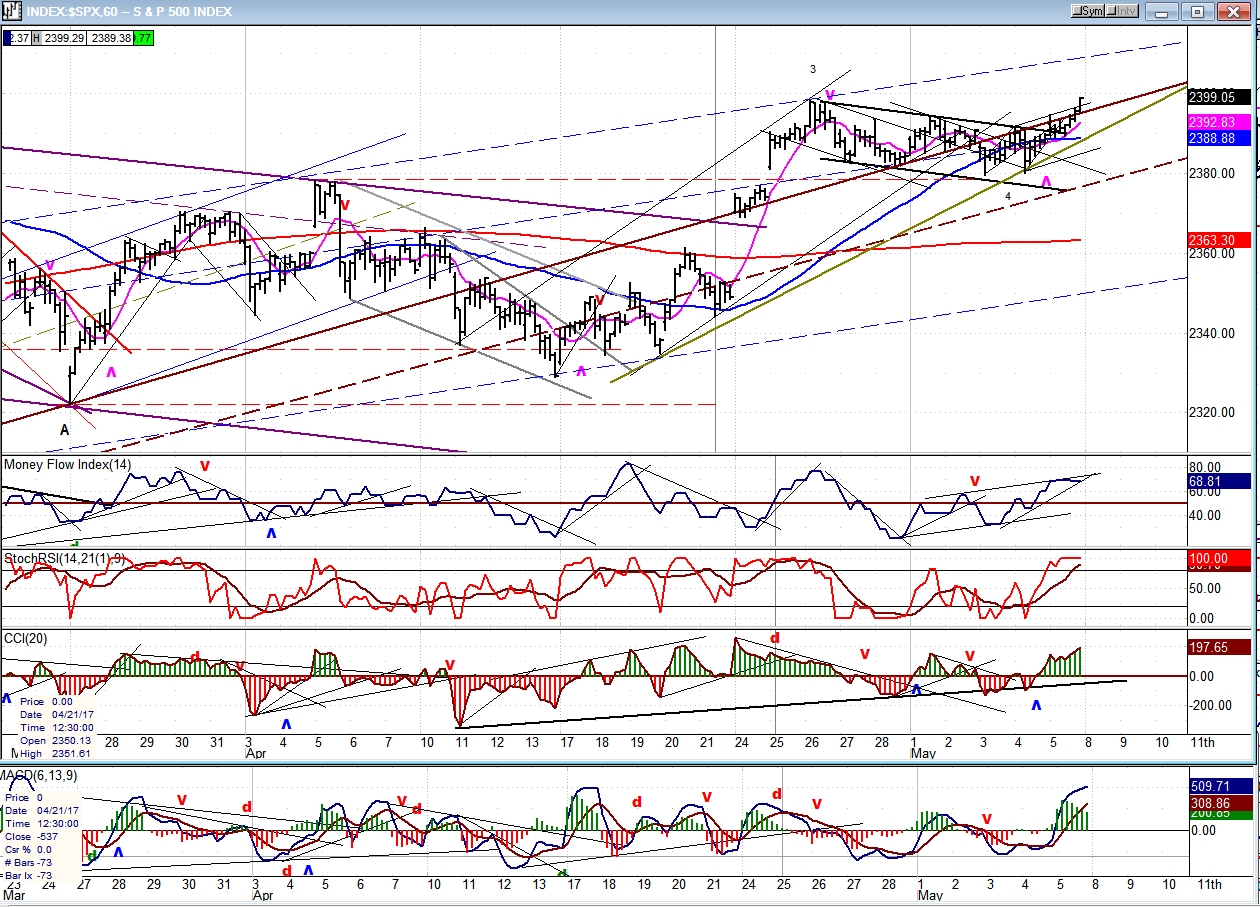
Hourly Chart
The 60-m chart made a good showing on Friday, closing at its high with a gain of 10 points. That put it back above the solid brown line which can be considered the alternate (non-parallel) channel line, after rising slightly above the former high of 2398. If we consider 2398 to be wave 3 from the 2323 wave A low, and the bottom of the following minor consolidation pattern to be wave 4-- we have already started wave 5 and it should terminate over the next couple of days.
The indicators are telling us that they are not ready to reverse immediately. They all made new highs and will most likely need to show some divergence before they can roll over into a sell signal by dropping below the zero line. At the same time, the index should penetrate all the uptrend lines which lie below it, as well as the red 200-hrly MA.
An Overview Of Some Important Indexes (Weekly Charts)
Last week’s rally primarily benefited the stronger index (the QQQ) which probably saw a rush of short-covering that took it to a new high. SPX, DJIA and IWM also returned to their highs or slightly higher. Not so for XBD and TRAN which remain the weakest of the lot.

UUP (Dollar ETF)
UUP has continued to correct all the way down to a very strong support level consisting of its 200-DMA, wedge bottom line, and the top line of its previous major corrective channel where it should and must find buyers if it is to avoid permanent technical damage.

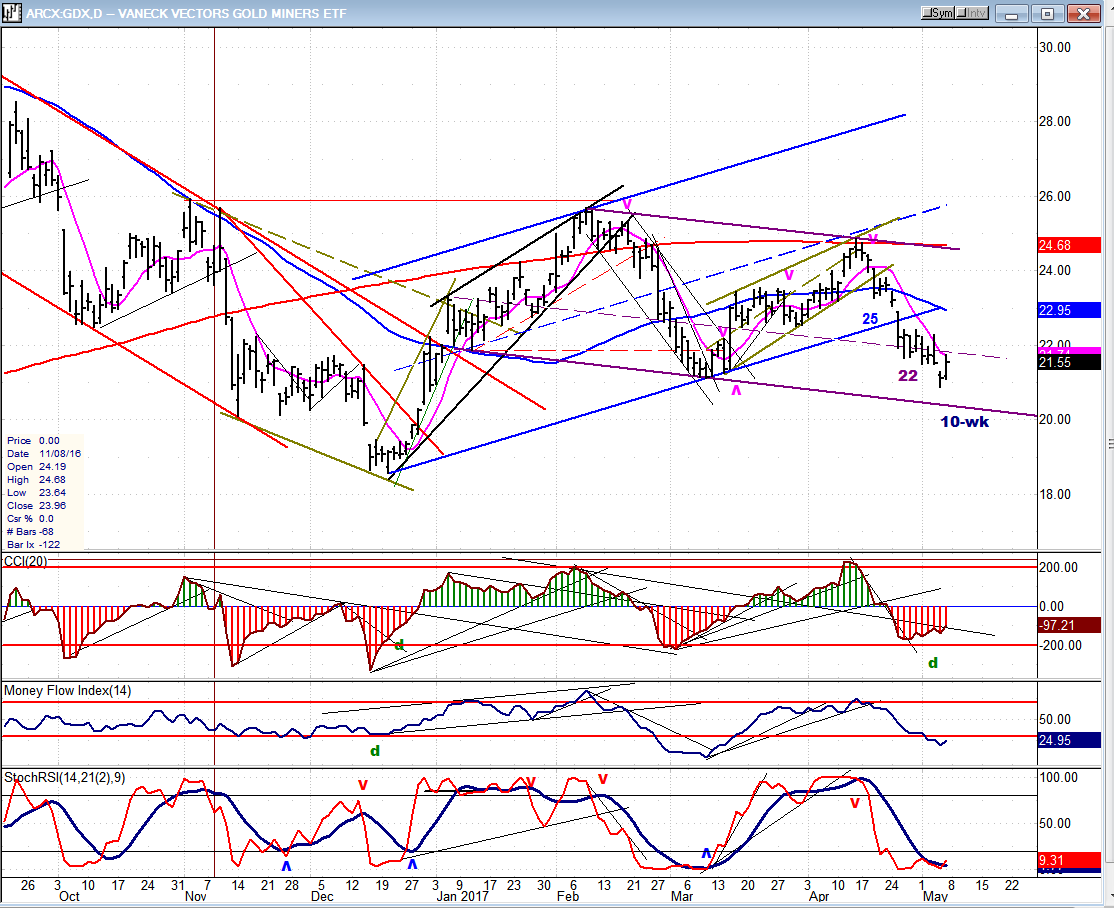
GDX (Gold Miners ETF)
GDX has continued to decline into its third consecutive cycle low, which is also the longest and strongest of the three. After the initial bounce which is underway, it is likely to retest the low before completing its corrective pattern and starting a powerful uptrend.
Note: GDX is now updated for subscribers throughout the day, along with SPX.
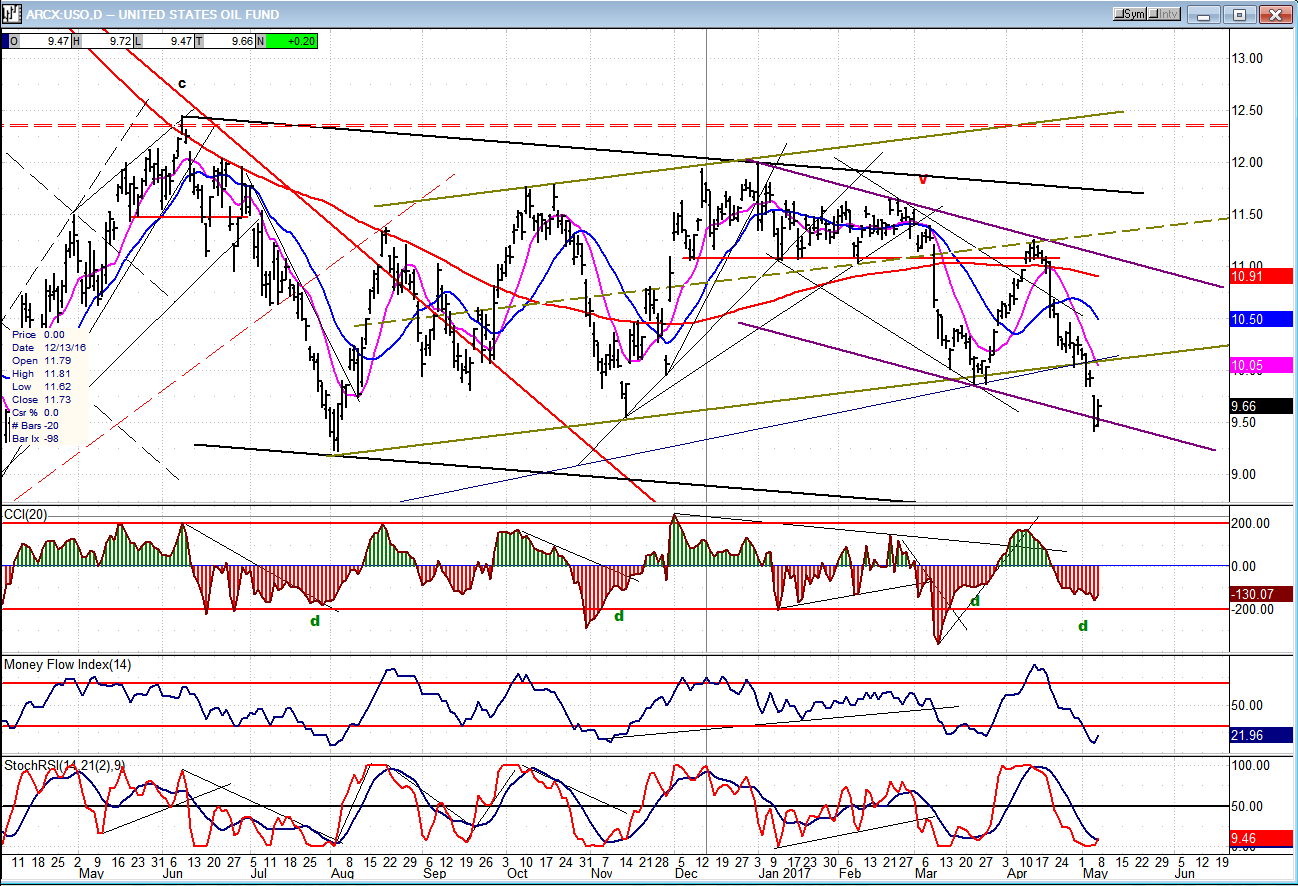
USO (US Oil Fund)
Is there any hope for USO to ever get back into an uptrend? Yes, but perhaps not right away and only in a limited manner. The recent price action has formed another corrective channel which is probably not complete, but a bounce from its low should be expected.
Summary
Getting to B took a while, but it looks as if we are finally there with just a little more upside action to make it perfect. Don’t let the recent strength fool you. If this is the top of the B-wave, the ideal top should come around 2410. Much beyond that and it’s back to square one.
********
For a FREE 4-week trial, send an email to [email protected], or go to www.marketurningpoints.com and click on “subscribe”. There, you will also find subscription options, payment plans, weekly newsletters, and general information. By clicking on "Free Newsletter" you can get a preview of the latest newsletter which is normally posted on Sunday afternoon (unless it happens to be a 3-day weekend, in which case it could be posted on Monday).
The above comments and those made in the daily updates and the Market Summary about the financial markets are based purely on what I consider to be sound technical analysis principles. They represent my own opinion and are not meant to be construed as trading or investment advice, but are offered as an analytical point f view which might be of interest to those who follow stock market cycles and technical analysis.

When Andre Gratian was a stock broker years ago, a friend introduced him to technical analysis of the market. Consequently, it is not an exaggeration to say that Andre fell in love with this approach! Ever since then, it has become an increasingly important part of his professional life. Gratian has studied the works of Wyckoff, Edwards & Magee, Edward J. Dewey (cycles) and many others. However, one of my most profitable undertaking has probably been to study Point & Figure charting, which he finds invaluable in analyzing stocks and indices. If he were restricted to one methodology, this is the one that he would choose. This well-rounded background has given him what he feels to be a special insight into the stock market, facilitating the recognition of meaningful patterns and the ‘turning points’ in all trends, whether they be short or long term. Andre feels very comfortable discussing the stock market and passing on meaningful information to others. His subscribers include individuals and money managers throughout the world. Moreover, his Newsletters are currently published on several financial sites, here and abroad.
More from Gold-Eagle


