Current US Dollar Trend Defined


Performance of the US Dollar Index has been stellar and is developing an interesting pattern that once complete around mid to late March 2015 will indicate the final upper target expected around August 2015. This report has a lot of technical information and might be considered “rather dry” to most, but I encourage the reader to wade through this, chew on it and digest it. For those who want the direct forecast up front, avoid commodities and go long S&P500 type of Exchange Traded Funds. By simply being conservative, 10-15% can still be made between now and August 2015.
Currencies
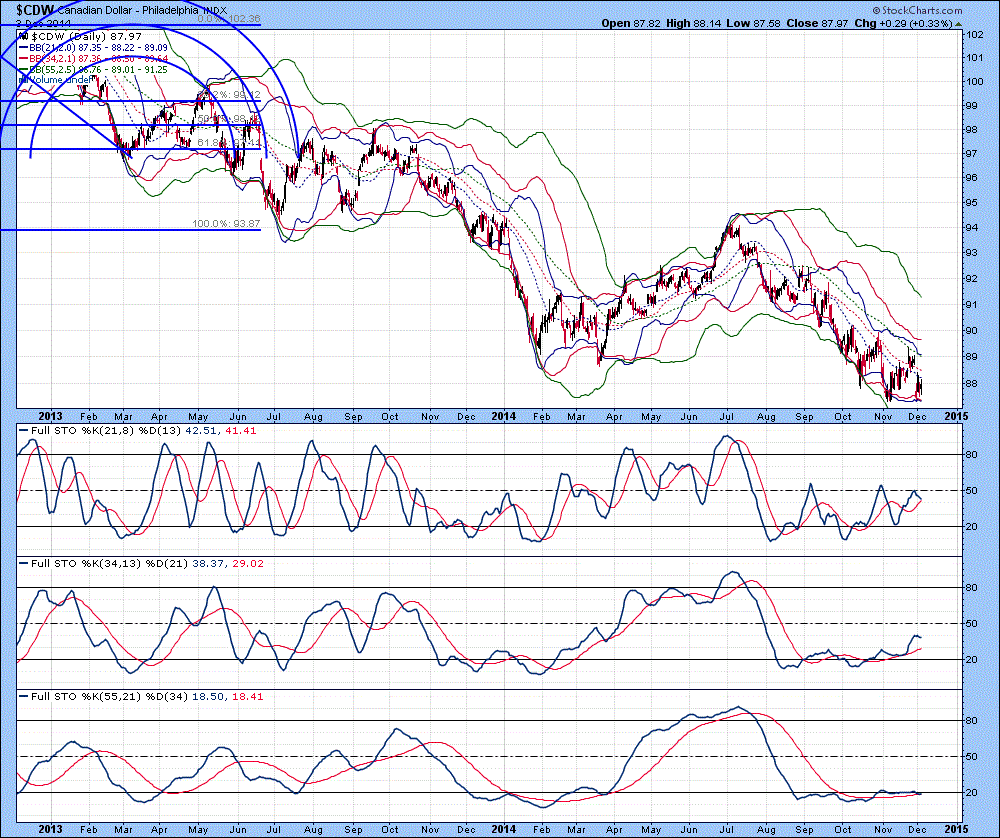
The daily chart of the Canadian Dollar Index is shown below, with the lower 21 MA Bollinger Band® marginally beneath the 34 MA Bollinger Band, indicates the potential for development of an oversold condition. Full stochastics 1, 2 and 3 are shown below in order of descent, with the %K above the %D in all three instances. There are positive divergences between the %K in stochastics 1 and 2. As indicated a few days ago, strength in precious metals and energy is likely to have strength into mid-March, based upon the US Dollar being in a corrective??? Mode until then. As we know, the US Dollar is forming a running correction, which implies a potential move to between 100 and 105 by November 2015.
The daily chart of the Australian Dollar Index is shown below, with the lower 21 MA Bollinger Band beneath the 34 and 55 MA Bollinger Bands, indicating an oversold condition is developing. Full stochastics 1, 2 and 3 are shown below in order of descent, with the %K beneath the %D in all three instances. Extrapolation of the %K trends in all three instances suggest at least 3-4 weeks of continued sideways to downward price action before any sort of a bottom is put in place. The measured move for the current decline lies around 78, so there still is the potential for another quick 6 cent decline. Please note that a decline to 78.0 could take up to 6 months. I am not focusing so much on the time component for the Aussie Dollar, but rather the expected price target.

The weekly chart of the Euro Index is shown below, with the upper 55 MA Bollinger Band still rising, indicates that a definitive bottom has yet to be put in place. The lower 21 MA Bollinger Band is beneath the 34 and 55 MA Bollinger Bands, indicates that a very oversold condition is developing. I do want to stress that very strong support at 120-120.5 exists, which is likely to serve as a temporary triple bottom. I do not see the US Dollar set to break out higher until at least mid to late March 2015, based upon the Elliott Wave count. So as the Euro constitutes some 57%ish of the US Dollar Index, a bottom in the Euro would translate into a pause in the rise of the US Dollar. Please keep in mind that this pause is only likely to last no later than early April. Full stochastics 1, 2 and 3 are shown below in order of descent, with the %K above the %D in 1 and beneath the %D in 2 and 3. The %K in stochastic 1 appears to have hooked down, indicating another 3-5 weeks of continued sideways to downward price action before a bottom is put in place. If things go as expected, the Euro could bounce up to 128 before turning down in early April 2015 and then falling like a stone to 110ish, with the potential for a slide to parity by November 2015. Being in the Euro over the next 11-12 months is likely to be a painful investment, so as I have mentioned, being invested in US Dollars in S&P 500 Index funds is probably the best way to preserve pension funds or any funds for that matter. After, there will be a window where transferring money into US Dollars around August 2015 is the trade, followed by converting US Dollars into another currency, Canadian Dollars for example. I might be wrong on this and maybe just being in short-term US Treasuries is the best investment. There is going to be a lot of defaults between 2015 and 2019 at all levels, so maybe a push in the US Dollar occurs before declining as a move into other currencies is required for those far and away to simply pay bills and live. More on this next week as I have to examine currencies at 2000, 2008 and 2012 to get some sort of framework to better define what to expect.

US Dollar Index
The daily chart of the US Dollar Index is shown below, with a price excursion above the 21 MA Bollinger Band, indicating an overbought condition is developing. Upper 34 and 55 MA Bollinger Bands are rising in close proximity to each other, which generally are signs of a top or consolidation. When 21 and 34 MA Bollinger Bands are in close proximity to each other with rising stochastics, this indicates further upside price action. Full stochastics 1, 2 and 3 are shown below in order of descent, with the %K above the %D in all three instances. Stochastics on this chart are not very telling as are Bollinger Bands so the main thing to examine is the overall chart pattern. Nothing but a series of higher highs and higher lows exist, so the overall upward trend remains locked in place.

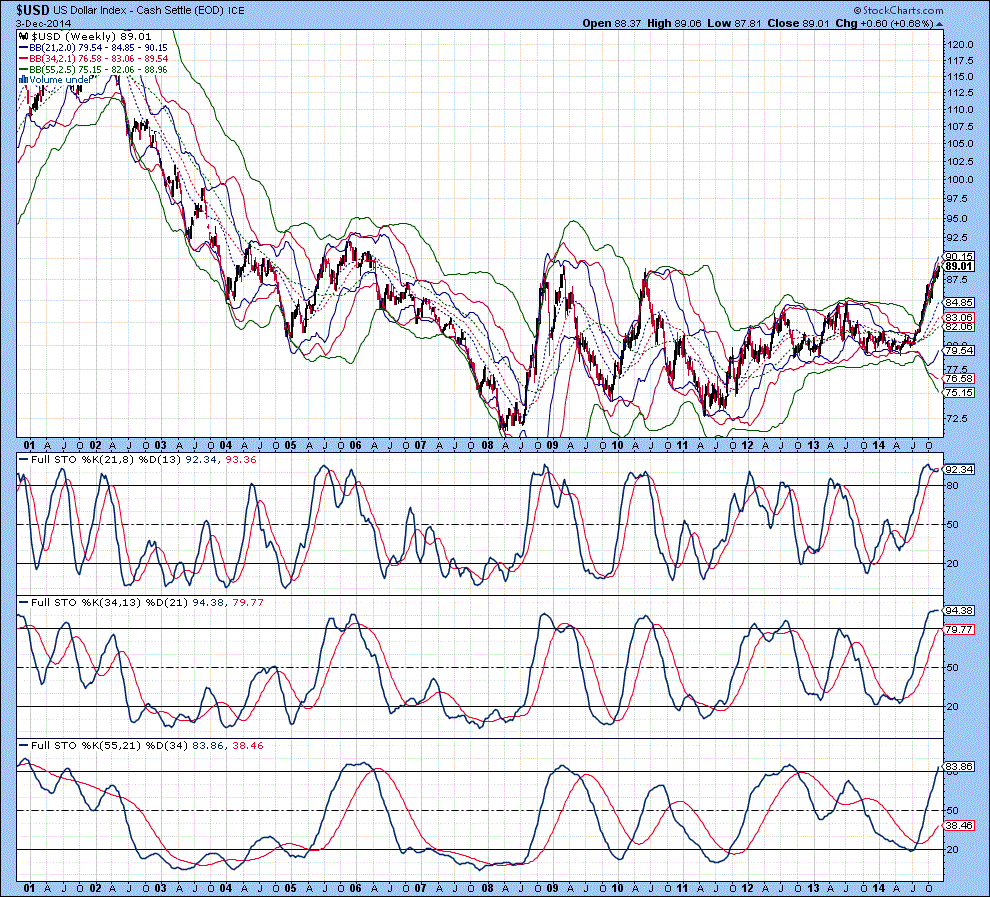
The weekly chart of the US Dollar Index is shown below, with the upper 21 MA Bollinger Band above the 34 and 55 MA Bollinger Bands, indicates that an overbought condition is developing. Lower 34 and 55 MA Bollinger Bands have yet to curl up to indicate a top has been put in place, so based upon this, there is at least another 6-8 months before any sort of a top is put in place. Structural information of the US Dollar Index is presented in Figures 7 and 8, which provide more on time frames etc. over the next 9-12 months.
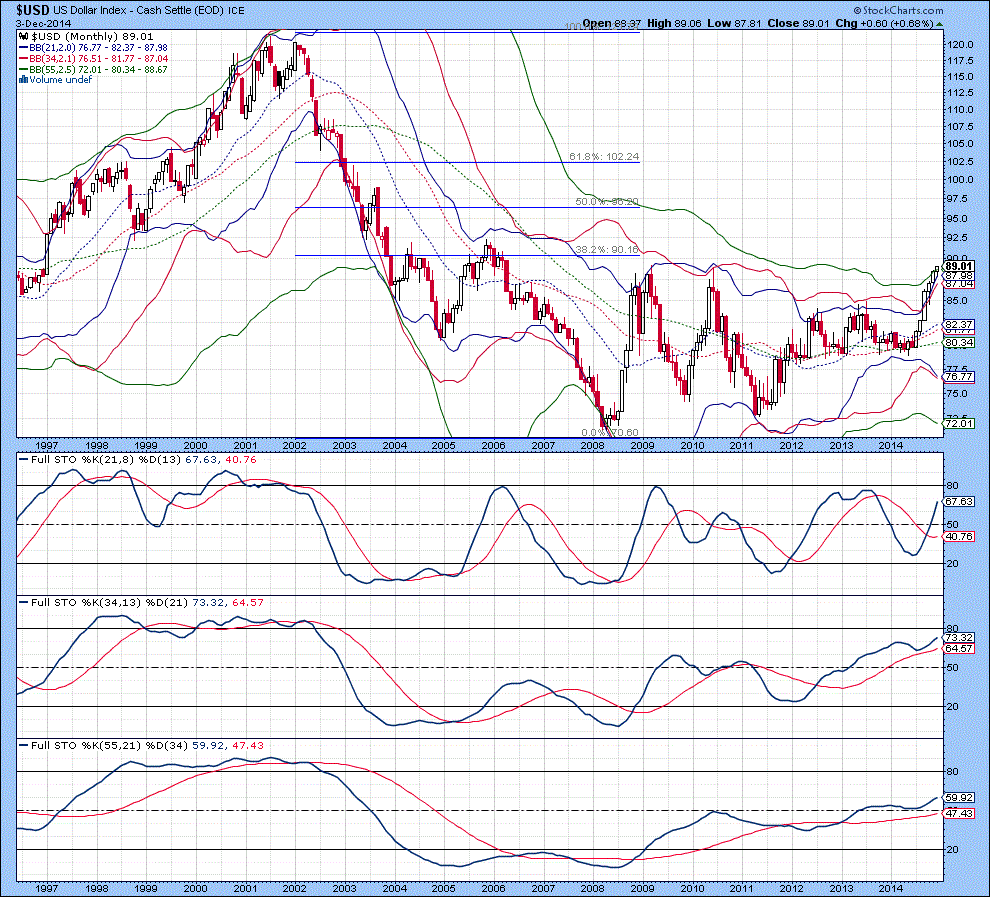
The monthly chart of the US Dollar Index is shown below, with the upper 21 MA Bollinger Band above the 34 MA Bollinger Band, indicates an overbought condition continues to develop. This one observation below is important and carries the most weight out of all three tops to aid in defining when the “big top” occurs. All three lower Bollinger Bands have curled down and it will not be until the lower 55 MA Bollinger Band curls up (It will be the last one of the sequence) that a top happens. I cannot really extrapolate anything for when that time is, but as a minimum, it is at least 10-12 months away. So, this strongly suggests that overbought conditions to extreme will develop on the daily and weekly charts. Watch lower Bollinger Band values closely and carefully, because when the 55 MA Bollinger Band does start to show a sign of inflection (curling up), it should correspond to a top or a looming top.
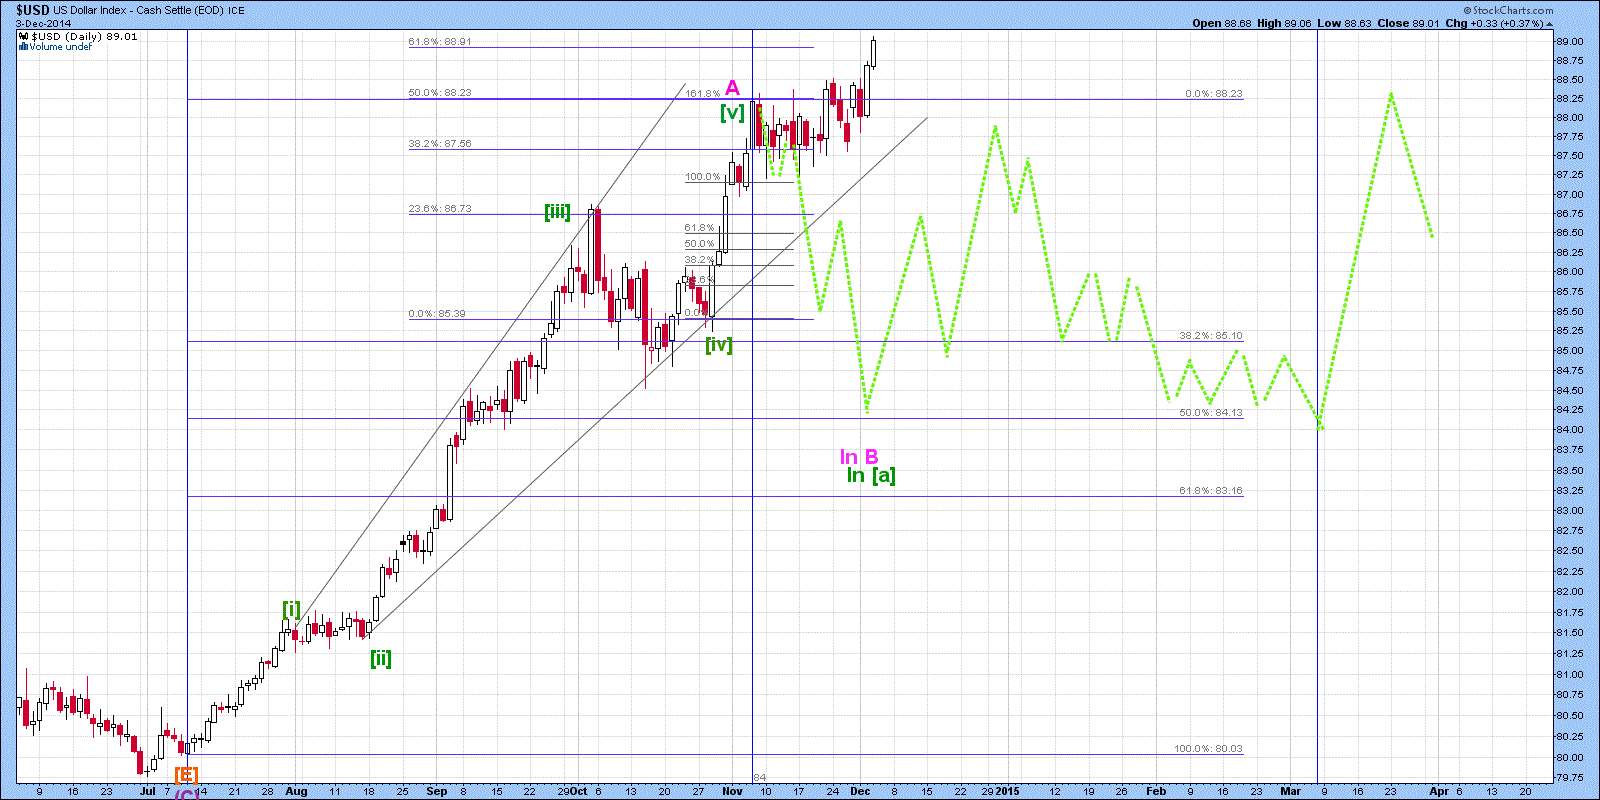
The short-term Elliott Wave count of the US Dollar Index is shown below, with wave B thought to be forming. When wave A completed, I sketched in what I thought was a reasonable pattern within a constrained period of time for wave B to develop. Since then, wave B has done nothing but continue to break higher. If the wave pattern that I have labelled is correct, then it implies a running correction for wave B is developing, which has huge implications for when the US Dollar starts wave 3 in mid to late March 2015. The US Dollar could fall back to the defined range, or merely continue to drift within the upper rising channel for another 3 months. In April when the US Dollar takes off, more capital will flow into it as others globally try to preserve their net worth against their erosion of their home currencies. This will cause further increases in the value of the broad stock market in the United States, which should aid to bring the S&P 500 Index to its target of 2450-2500. Wave A was 8 cents, so wave B at a minimum should also be 8 cents. If wave B is forming a running correction however, this value is minimally set to extend to 61.8% and maximally to 161.8%. Assuming wave B completes at 89 in mid to late March, then the range for the top becomes 13 cents, or 95 and 102. This is quite a broad range, but as mentioned last week, a running correction places the US Dollar in the range between 100 and 105 by November 2015 (A running correction would likely see wave B terminate around 93-95). The November time frame was derived from wave C being equivalent to the sum of time taken in waves A and B. This number could extend into December, so whenever wave B does complete, add the amount of time in waves A and B, tag it onto the start of wave C and this is when the pattern should terminate in the future. Yes it is kind of rough, but it does provide a reasonable estimate. I should mention that I expect the pattern lasting into November 2015 to take on a zigzag (5-3-5) structure, so the move after March 2015 should be rather sharp to the upside.
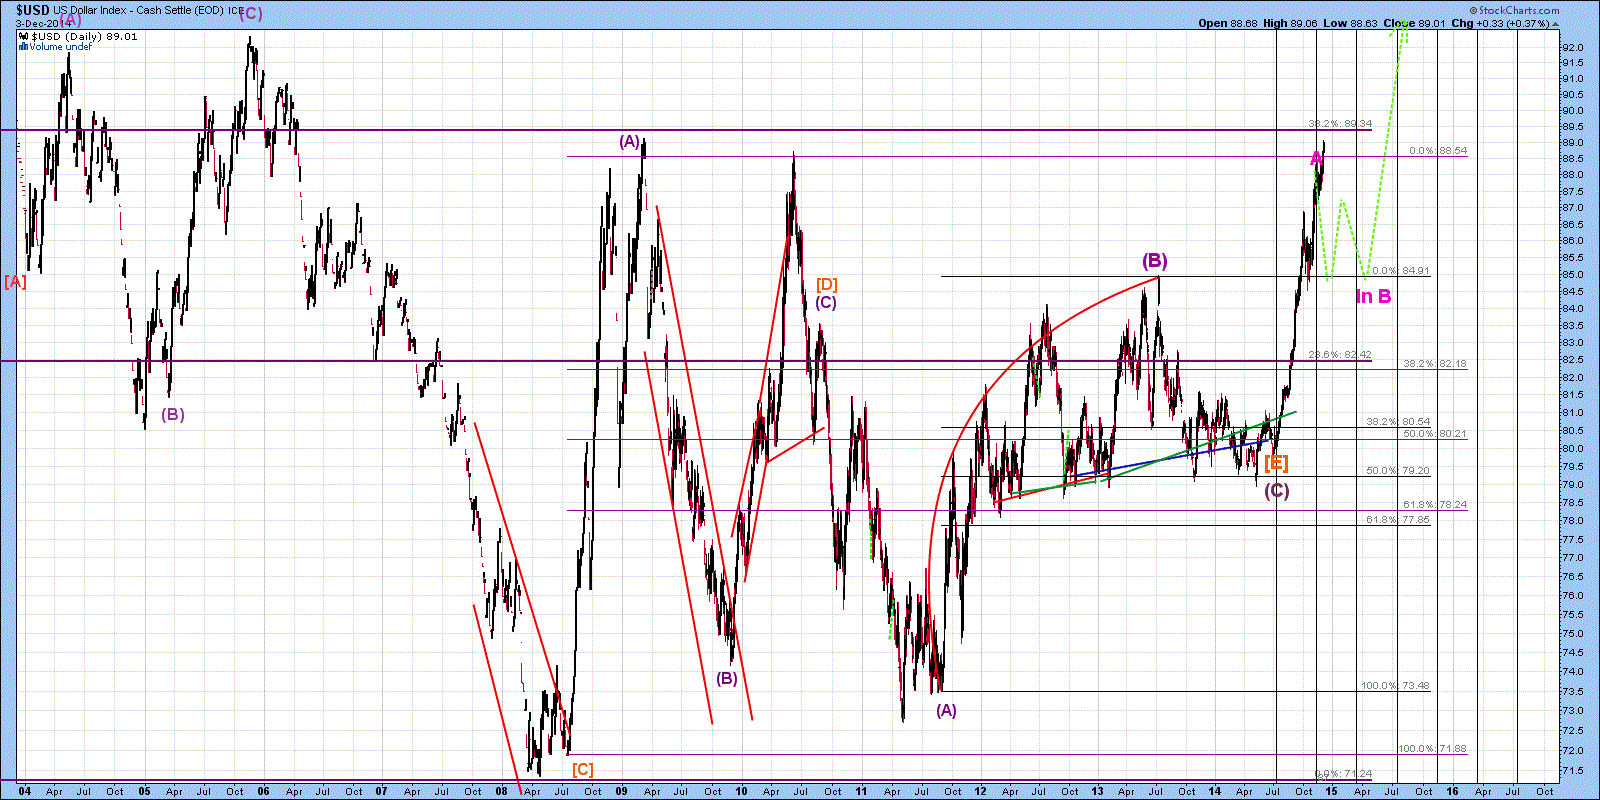
The mid-term Elliott Wave count of the US Dollar Index is shown below, with the longer-term view clearly seen. Wave [E] marked the end of a long-term pattern, which did have two Head and Shoulders patterns indicating a potential move to 73.0. This was invalidated by the US Dollar Index breaking above 81.7, which put a minimum move to 88.0, which clearly did occur. Invalidation of the move to 73.0 also indicated the termination of wave [E] and the start of a new longer-term pattern. As I mentioned back in September, the US Dollar Index started a new bull market that should last at least 5-6 years. There will be ups and downs, but remember, the move into late 2015 is only the FIRST SEGMENT of that pattern. Wave (A) should mark the termination point of this pattern in November 2015 (I might have to raise the Degree of the count to wave [A]), that should be followed by wave [B]. Power retracements of zigzags range from 0 to 100%. If wave C.(A) is the longest of the pattern, then it sets the stage for a potential triangle or other complex pattern. I am not going to predict what sort of pattern forms beyond November 2015, as it could develop into a double combination (heading much higher) or have a partial retracement. Focus on the scenario described to happen between now and next November….
*********
Copyright © 2014
www.treasurechests.info All rights reserved.
Unless otherwise indicated, all materials on these pages are copyrighted by www.treasurechests.info. All rights reserved. No part of these pages, either text or image may be used for any purpose other than personal use. Therefore, reproduction, modification, storage in a retrieval system or retransmission, in any form or by any means, electronic, mechanical or otherwise, for reasons other than personal use, is strictly prohibited without prior written permission.
Disclaimer: The above is a matter of opinion and is not intended as investment advice. Information and analysis above are derived from sources and utilizing methods believed reliable, but we cannot accept responsibility for any trading losses you may incur as a result of this analysis. Comments within the text should not be construed as specific recommendations to buy or sell securities. Individuals should consult with their broker and personal financial advisors before engaging in any trading activities. We are not registered brokers or advisors. Certain statements included herein may constitute "forward-looking statements" with the meaning of certain securities legislative measures. Such forward-looking statements involve known and unknown risks, uncertainties and other factors that may cause the actual results, performance or achievements of the above mentioned companies, or industry results, to be materially different from any future results, performance or achievements expressed or implied by such forward-looking statements. Do your own due diligence regarding investment decisions.
 David Petch is a cofounder of www.treasurechests.info which has been in existence since 2003. His technical analysis focuses on Bollinger bands, stochastics (using daily, weekly and monthly charts), as well as extensive Elliott Wave analysis. His recent discovery of the Contracting Fiboancci Spiral the broad stock market indices are trapped in has indicated every major top since its inception in 1932. The CFS cycle also identifies expected major tops between now and 2020. David holds a BScH and MSc in Microbiology.
More from Gold-Eagle


